| The Wagner Daily ETF Report For January 11 |
| By Deron Wagner |
Published
01/11/2013
|
Stocks
|
Unrated
|
|
|
|
The Wagner Daily ETF Report For January 11
A sign of a strong bull market is when the major averages are able to fight off early weakness, push higher in the afternoon, and close near the highs of the day. Such was the action in the market on Thursday, as stocks sold off early but were able to rebound in the afternoon. The strong reversal action led to a fresh 52-week closing high in the S&P 500.
Total volume increased by 9% on the NYSE, allowing the S&P 500 to register a bullish accumulation day. Volume was up by less than 1.0% on the Nasdaq. The major averages have fought off distribution on two occasions this week, which is a bullish sign. The averages could have easily rolled over and closed at the lows of the day, but we continue to see buying interest on dips. Leading stocks are acting well and recent breakouts are working. These are clear signs that the market is getting stronger.
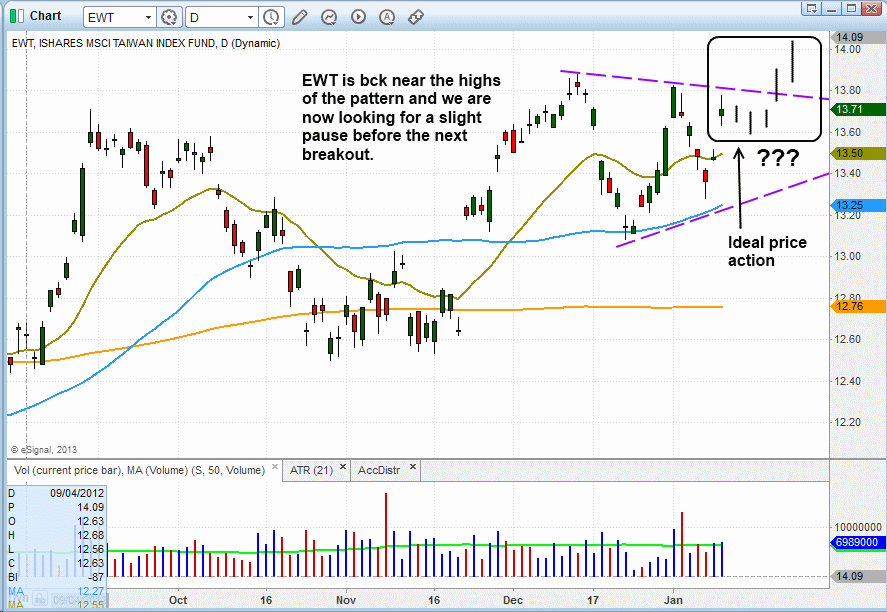
The iShares MSCI Taiwan Index ($EWT), which we initially pointed out as a potential buy setup in this recent post on our trading blog, triggered an "official" buy entry in our model ETF trading portfolio on January 9, after it rallied above the high of January 8. Taking an updated look at the open position, it now looks as though $EWT is forming a bullish pennant pattern, which means it is setting a series of "lower highs" and "higher lows" within a tight range. This pattern usually indicates a resumption of the current trend, so we anticipate further gains in $EWT in the coming days:

With this ETF, we ideally would like to see some sort of short pause, such as two to three days of sideways action, above the $13.50 level. This would generate another low-risk buy entry that would allow us to add to our position, in anticipation of the ETF breaking out sometime next week.
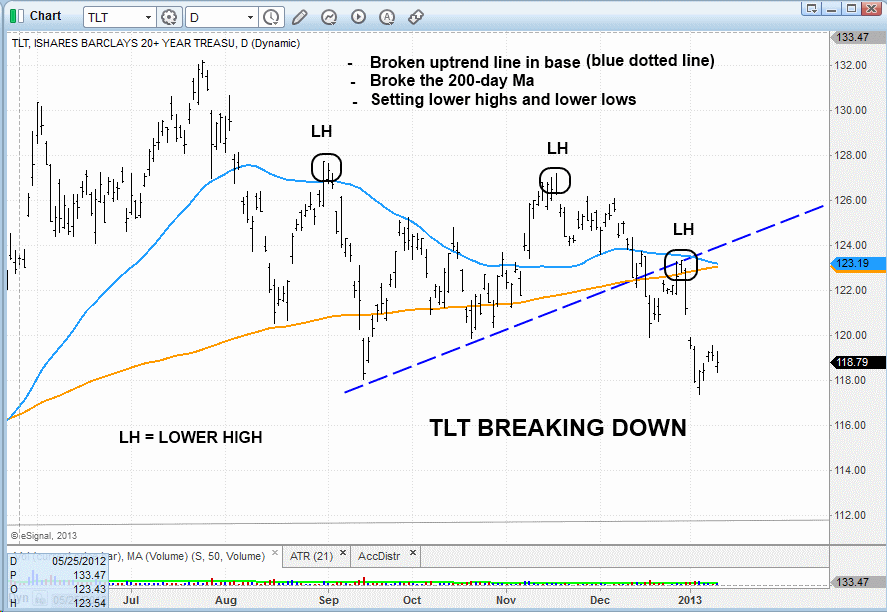
Although not an actionable swing trade setup, the daily chart of iShares Barclays 20+ Yr Treasury Bond ($TLT), a fixed-income ETF, is confirming the current strength in equities. The breakdown in the bond market shows investors moving out of safety (bonds) and taking on risk (stocks). We also see that the 50-day moving average is about to cross below the 200-day moving average. This bearish moving average crossover is known as the "death cross" because is signals a major (negative) shift in the dominant trend:

Deron Wagner is the Founder and Head Trader of both Morpheus Capital LP, a U.S. hedge fund, and MorpheusTrading.com, a trader education firm.
|