| The Wagner Daily ETF Report For January 14 |
| By Deron Wagner |
Published
01/14/2013
|
Stocks
|
Unrated
|
|
|
|
The Wagner Daily ETF Report For January 14
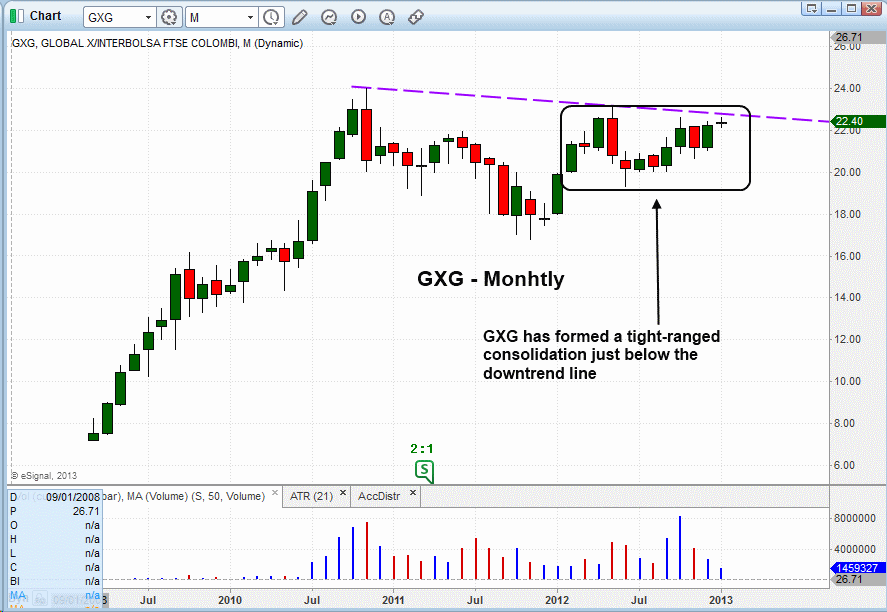
For the past few weeks, we have been monitoring the price action in Global X InterBolsa FTSE Colombia 20 ETF ($GXG) for a decent, low-risk buy entry. Before we dive into the daily chart and our technical swing trading buy setup, let's revisit the long-term monthly chart we initially posted to subscribers a few weeks ago. Looking at the "big picture" before analyzing shorter-term patterns helps to ensure we are trading in the same direction as the dominant trend:

Looking above, notice that $GXG has been forming a tight consolidation since May of 2012. Now, a convincing breakout above the $22.70 area should quickly lead to a move to test the all-time high, around $24, which was set in late 2010. Given that the high was set more than a year ago, one would not expect the ETF to find much technical price resistance near that level.
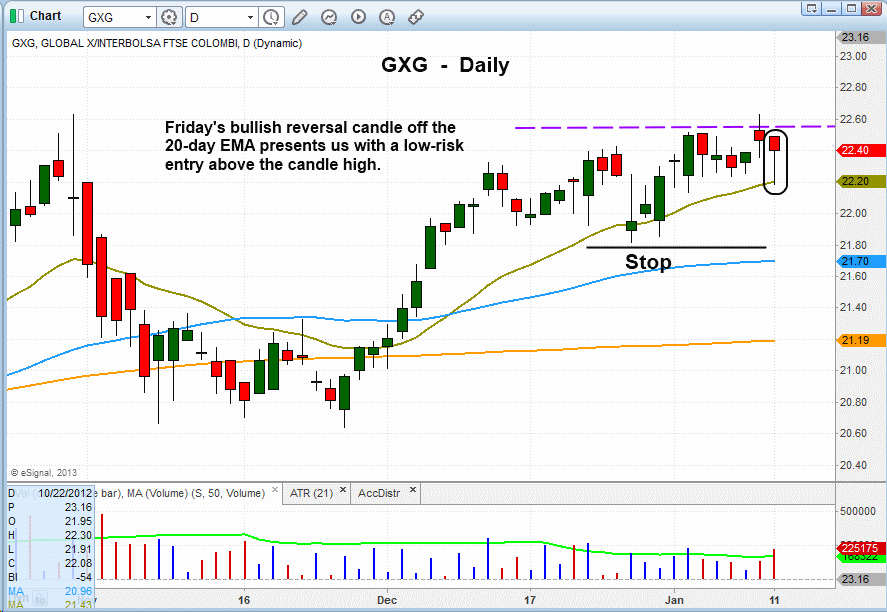
Dropping down to the shorter-term daily chart, notice that $GXG formed a bullish reversal candle on January 11, which coincided with the intraday low bouncing off near-term support of the 20-day exponential moving average (beige line). Now, if $GXG manages to rally above last Friday's high, it may generate an ideal, low-risk buy signal for swing trade entry:

Note that a breakdown below the 20-day EMA, which would correlate to a move below last Friday's low, would negate the setup for now, and would likely lead to a drop down to the 50-day moving average (teal line). For our exact entry, stop, and target prices for this trade setup, regular subscribers of The Wagner Daily should note the ETF Watchlist section of today's newsletter above.
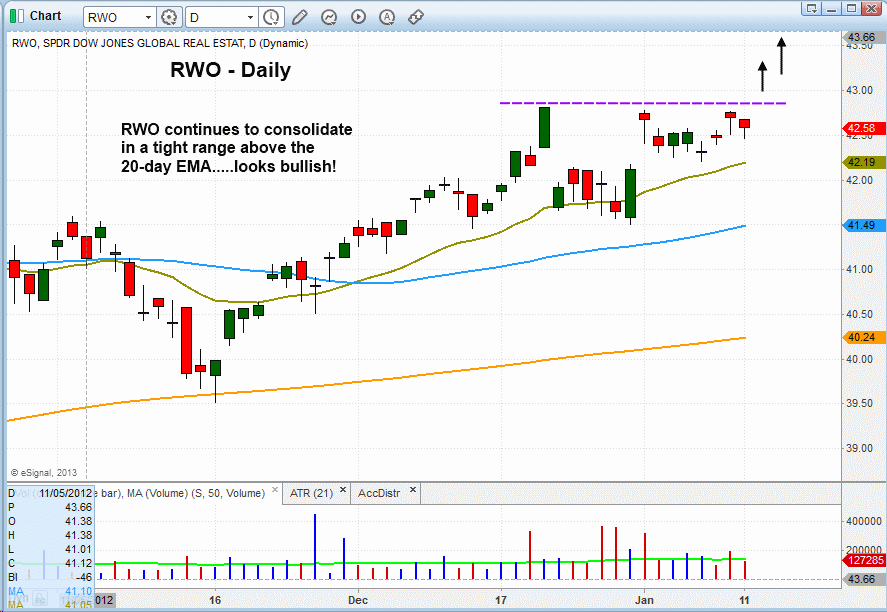
Last week, SPDR Dow Jones Global Real Estate ETF ($RWO) triggered a buy entry in our swing trading ETF portfolio, and it technically remains in good shape. We always prefer to see chart patterns tighten up right before they breakout above the range highs, and $RWO has tightened up nicely over the past two weeks, while holding above the 20-day EMA at the same time:

Deron Wagner is the Founder and Head Trader of both Morpheus Capital LP, a U.S. hedge fund, and MorpheusTrading.com, a trader education firm.
|