Stocks are mixed again today, although all the major averages are treading water near breakeven levels. It's if traders are a little uneasy about moving forward (as they should be), but unwilling to get out now - in case the rally isn't over yet. Now with the second day of flat and narrow trading, buying enthusiasm is tapering off. As for the charts, well, there's a lot to talk about. Let's just take a look.
NASDAQ Commentary
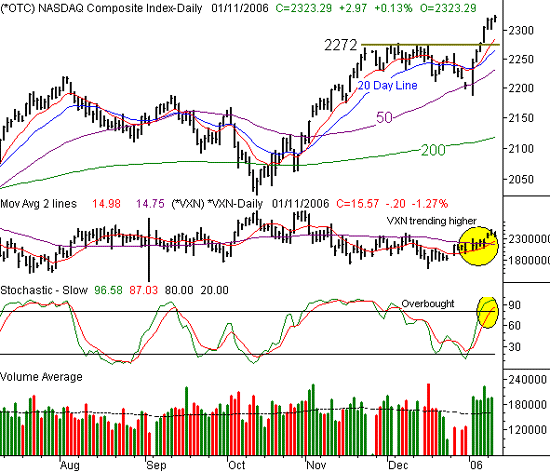
It was at this time last week we were talking about resistance at 2272. Well, you can forget about that now - it's been broken....with a vengeance. The NASDAQ current reading of 2323 is a new multi-year high, and the volume behind this recent move has been solid. For the week, the composite is up 17.6 points (+0.77%), and for the year it's up 5.3%. That's impressive to say the least, especially considering things looked awful as we closed out last year. So why aren't we bullish?
At the risk of being repetitive, this bizarre degree of bullishness isn't exactly healthy. Volume has been strong, which is a key confirmation of bullishness, but breadth and depth have been unusual to the point of being dangerous. Case in point - too many new highs. Additionally, we're well overbought. That in itself isn't necessarily bearish, but under these conditions where the market has been reversal-prone for a while, it heeds caution for the bulls. Plus, the incredibly low VIX and VXN readings finally appear to be trending higher again. A really bullish market can fend off the VIX reversals for a while, but eventually a price has to be paid. It may take a few days to materialize, but the rising VXN will eventually take a toll on the market. How much of a toll is still in question.
All of these items are plotted on our daily chart below. From top to bottom.......
As we said, the resistance at 2272 has been broken. That's technically bullish, but we'll come back to that in a second. However, the VXN is moving higher after a deep lull. Usually, like it did in July and early October, this sets up a pullback for stocks. It doesn't have to be a very big pullback to get the VXN back to tolerable levels, but it's going to be tough for the market to move any higher while the VXN is coming off those lows. Under that, we can clearly see that the NASDAQ is stochastically overbought, as both of the stochastic lines are now above 80.. As we mentioned, that in itself is not a bearish problem, as the market can stay overbought for long periods of time (like November). But given the combination of the low VXN, the uncanny gains from last week, and being overbought, we expect to see the composite come under fire very soon. At the bottom of the chart is volume, which has been the trump card so far this year. Obviously there's been a lot of money poured into stocks in 2006.....and it's been persistent. In fact, it's been the strongest high-volume streak we've seen on months. Take a look at the chart below, then read on for our thoughts on that volume.
NASDAQ Chart - Daily

Where's all that volume coming from? And what prompted it? From a valuation perspective, stocks aren't that much better now than they were in the latter half of 2005. Our initial thought was that it was heavy short covering sparked by the big reversal at the beginning of the year. But the volume hasn't back ed off since then - we've seen six straight days of big volume, so now we have to start thinking that it could be the institutions. Note that we're not saying that's what it is - we're just saying it's a possibility. We remain unconvinced as of yet. The real test will come when we get that first shakeout, which shouldn't be too far away. If the same amount volume is seen on selloffs, we can safely say that it wasn't institutional buying. If volume is weak on the next selloff, then you may want to use the dip as a buying opportunity.
So then, the next chart even to watch for is the pullback. We're planning on seeing a dip all the way back to the 20 day average near 2266, or even the 50 day line at 2230. It was, after all, the 50 day average that sparked the current upward surge. That size of dip should sufficiently push the VXN back to more tolerable levels. Once we retest either of those two moving averages, we'll then make a determination based on volume.
S&P 500 Commentary
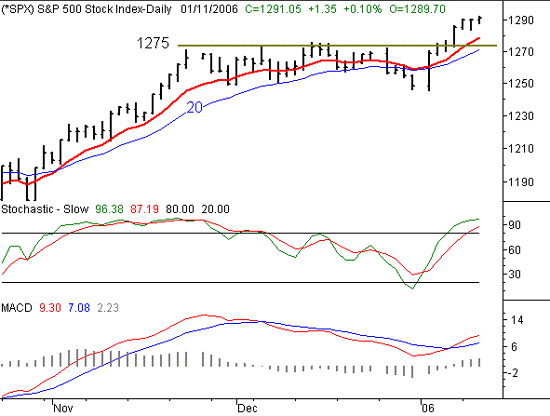
We went long with the NASDAQ commentary, so we'll be brief here. Plus, there's not a lot to add about the S&P 500 chart. Like the NASDAQ, the SX has got some technical momentum, but is also stochastically overbought. Obviously both tools can't be right, so we're forced to look at other clues.
One such clue is is the shape and change of each day's bars (candlestick analysis). This type of analysis is a little less structured than traditional technical analysis, but can still shed some light for us. The only significant pattern (in our view) is the SPX's doji (where the open and close are basically the same) from yesterday. It was also a 'hammer', as the bar literally looks like a hammer.....or a mallet, to be specific. These kinds of bars often come at key reversals, as it suggests that the buyers have finally reached an equilibrium with the sellers. The other indexes haven't quite given the same hints, although the Dow closed flat yesterday, and is showing us a doji for today (so far). So, we'll at least say that the underlying dynamic is changing.
We'll set support for the S&P 500 at 1275, where the 20 day line will be soon, and where the prior resistance level was. We'll also plot support at 1253, where the 50 day average is (not shown).
S&P 500 Chart - Daily

Dow Jones Industrial Average Commentary
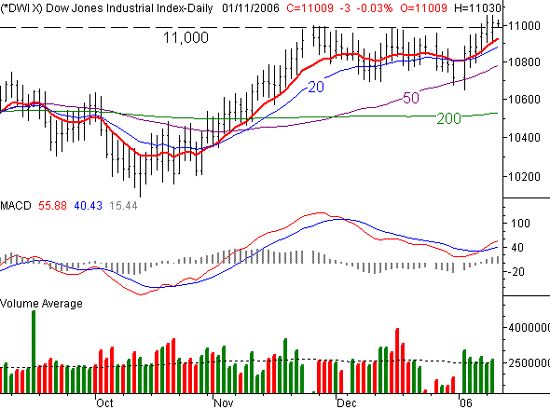
The Dow finally broke through the much-discussed 11,000 mark. We regard that as bullish - in a general sense. However, we would also advise caution for anyone who was absolutely convinced that breaking that resistance line is going to usher in a new era of unprecedented bullishness. So far, the 'breakout' hasn't materialized. We suspect that most of the market was using this level as a sell point, which should keep the bulls in check. But still, the MACD crossover and the lack of a complete implosion now that 11,000 has been reached says that the market is not totally uncomfortable with new highs....especially considering that the NASDAQ and the S&P 500 are already at the new-high point.
Any pullback will be least felt here. The worst case scenario would be a dip to the 50 day moving average at 10,800, but the 10 and 20 day lines have done a very good job of keeping the Dow afloat. They're at 10,927 and 10,881, respectively.
We'll just add that the Dow stock volume has actually been the least impressive. In fact, you can also see that what little bullish volume there was early in 2006 has been dwindling. Bearish? Actually, more the opposite. While the blue-chip buying interest has weakened, the NASDAQ's volume has been growing. That migration into speculative names is actually a bullish sign for the overall market, but again will leave the Dow playing second fiddle - if the rally persists. And that, ultimately, is the question.
We're just as interested in what happens with the Dow's volume during the next pullback as we are the NASDAQ's. If we see migration into these blue-chip names (or at least relatively less selling), it could signal some general skepticism for all stocks......in that folks are seeking safety. That will be a 'bigger picture' bear signal we'll be looking for.
Dow Jones Industrial Average - Daily

Price Headley is the founder and chief analyst of BigTrends.com.