| The Wagner Daily ETF Report For January 23 |
| By Deron Wagner |
Published
01/23/2013
|
Stocks
|
Unrated
|
|
|
|
The Wagner Daily ETF Report For January 23
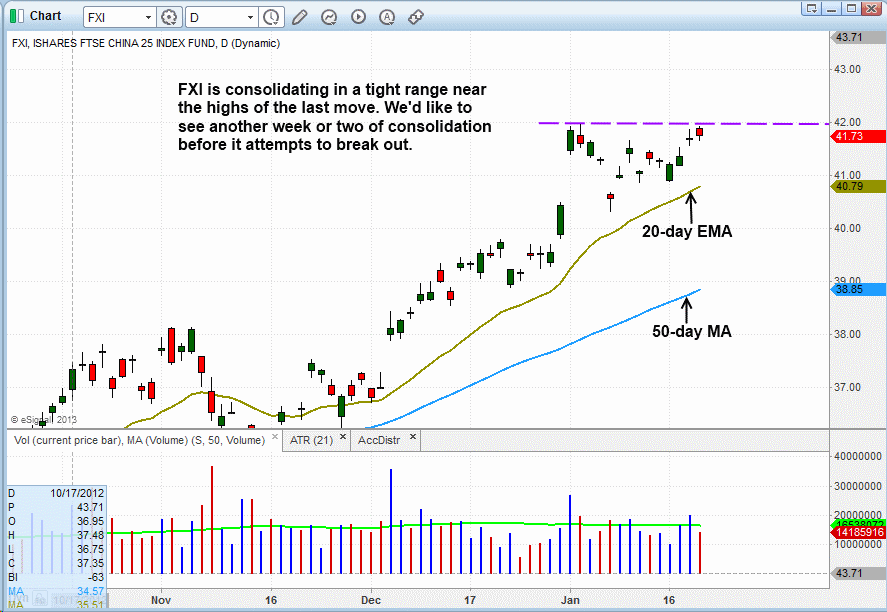
The iShares FTSE/Xinhua China 25 Index ($FXI) is consolidating near the high of its last move. In the near-term, $FXI would present the most ideal swing trade buy entry point if it underwent some sort of false breakout action, followed by a selloff to the rising 20-day EMA (around the $41.00 area). However, regardless of whether it continues to hold near the $42.00 level or retrace a bit lower, we feel the ETF needs another week of sideways price consolidation to produce a decent base of support. Presently, $FXI is only 13 days into its current base, and we prefer to see at least 15 to 20 days of basing action before a breakout. The current daily chart pattern of $FXI is shown below:

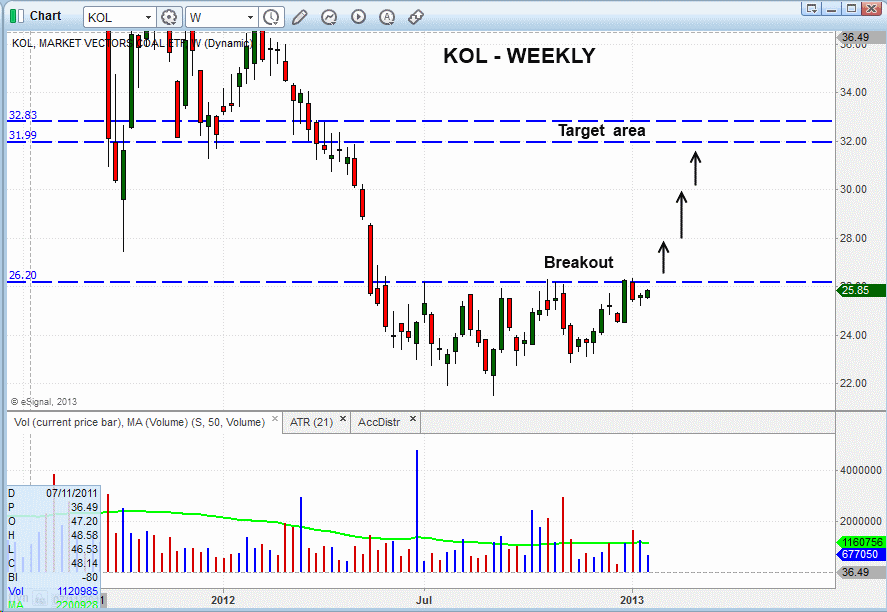
In yesterday's technical ETF commentary, we said Market Vectors Coal ETF ($KOL) was niely positioned for technical trade entry, and we are now "officially" long in our model ETF portfolio. Nevertheless, $KOL still has some work to do, as it must break out above the high of its current trading range (over the $26 level). If it convincingly moves above this level, we could possibly see a rapid move to the $32.00-$33.00 area. This price range marks a prior support level that should now act as resistance on the way up. The longer-term weekly chart of $KOL below illustrates this:

Notice on the chart above that there wasn't much trading that took place in the $26.00 to $32.00 range when the ETF was formerly in a downtrend. This means there is minimal overhead price supply, which could enable the price to easily run to $32.00 if the breakout generates enough momentum. This makes for a very favorable reward to risk ratio, meaning there is quite a bit of upside (reward), while still allowing for a fairly tight stop (risk).
Deron Wagner is the Founder and Head Trader of both Morpheus Capital LP, a U.S. hedge fund, and MorpheusTrading.com, a trader education firm.
|