| The Wagner Daily ETF Report For January 29 |
| By Deron Wagner |
Published
01/29/2013
|
Stocks
|
Unrated
|
|
|
|
The Wagner Daily ETF Report For January 29
Because our model ETF and stock portfolios are already holding a significant number of open positions, and the major indices are a bit extended in the near-term, we are not looking for new swing trade entries going into today's session. However, today's technical trading commentary will cover a few ETFs that are consolidating near their highs, but need a few more weeks of basing action to provide us with ideal, low-risk momentum trading entry points.
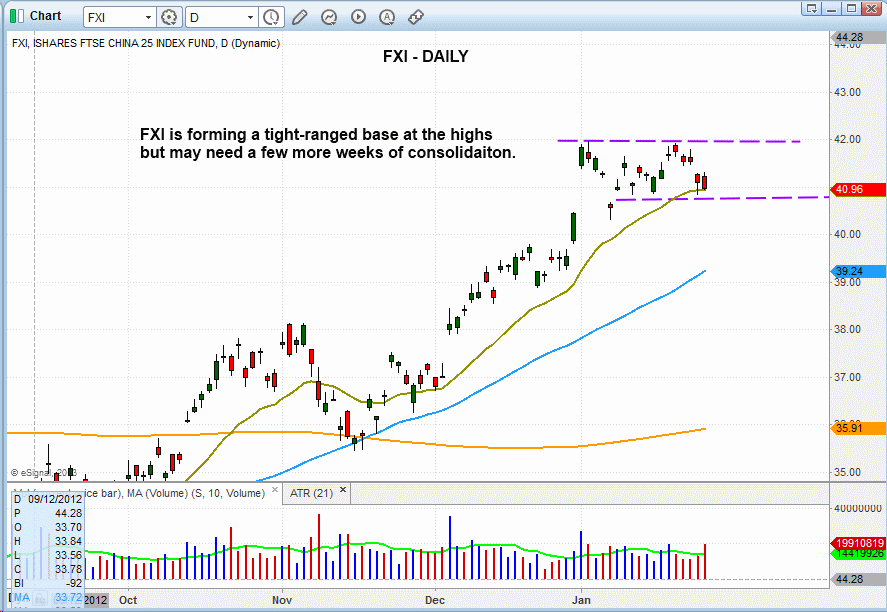
The iShares FTSE/Xinhua China 25 Index ($FXI) has been consolidating in a tight, sideways range near the highs of its last wave up, but it's a bit too early in this stage of the base to begin buying. In order to buy $FXI, we would first like to see the price action establish one or two "higher lows" within the base:

When a stock or ETF enters pullback mode after a strong run up, we prefer to see the price action correct no more than 38% off the highs of the prior wave up (which is based on a Fibonacci retracement. In the case of $FXI, we measure from the base breakout at $35.70, up to the high at $42.00. A 38% retracement of this move is the $38.80 area. Therefore, if $FXI is to maintain momentum of its last move up, the current consolidation should not break down below the $38.80 level.
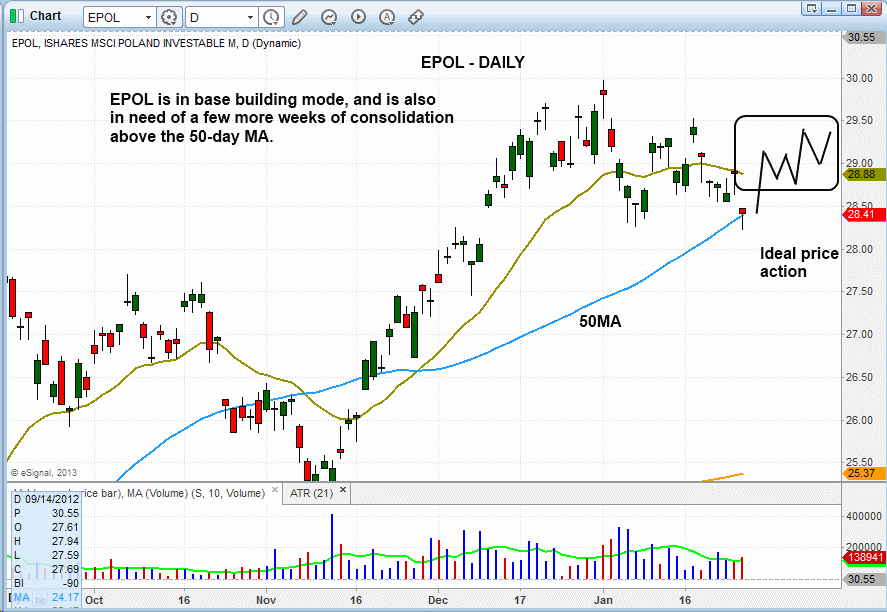
The iShares MSCI Poland ($EPOL) is another ETF in consolidation mode. However, unlike $FXI, $EPOL failed to extend much beyond its last breakout pivot (just below $28.00). This is shown on the daily chart pattern of $EPOL below:

Over the next few weeks, $EPOL must hold above intermediate-term support of its 50-day moving average and establish one or two higher "swing lows" within the base. As a guide, one could look for a breakout of the short-term downtrend line, which would be a sign that price action is improving. To draw the short-term trendline, start from the high of Jan. 2 and connect the line to the high of Jan. 17.
Deron Wagner is the Founder and Head Trader of both Morpheus Capital LP, a U.S. hedge fund, and MorpheusTrading.com, a trader education firm.
|