Ok, so we're not on a perfectly organized trek here â€" forgive the temporary break from optimization of trading systems. My number tweaking never stops. Although it's slowing down a bit now, because I'm taking it upon myself to share the results with the world. And no, I'm not complaining. Anyway...
Here is something I find pretty interesting. If yesterday's close was less than yesterday's open and the same held for the day before that, be a buyer. If yesterday closed higher than the open and so did the day before, be a short seller. Exit on the close.
This seems to be a credible market "driver," as the experts call it. On occasion, haven't you found yourself in the middle of a trading day wondering if the market is going to "pull the same stunt" it did yesterday? Haven't you wondered how many days in a row "the boys" can push it lower…or higher?
We've already documented biases following a number of close-to-closes in the same direction. (You fade the direction.) There is also a bias related to the opening, as many mechanical traders have affirmed. This is different than close-to-close analysis. You can be talking about a buy off an opening that gapped sharply lower than the previous day's low, for example. If the market still closed lower, the media might be calling it a down day, but anyone day trading it would have had a totally different perspective. (The buy side was the one rewarded.) The pit (or electronic field) will treat an opening as ground zero, and if the same result happens twice in a row you may legitimately find yourself questioning the likelihood of it happening again.
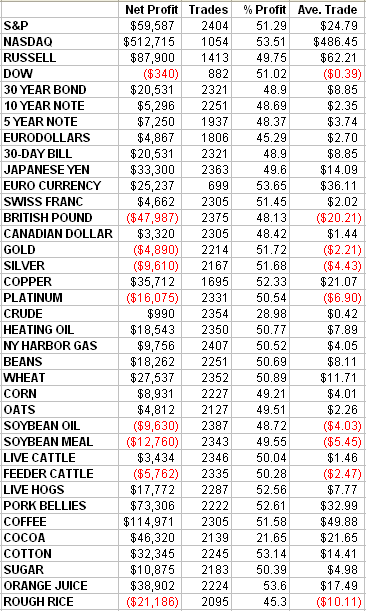
This is one of those relatively rare times where results mesh with intuition. The following is a table tracking 20 years of history through all the major commodity markets fading two same directional open-to-closes in a row.

This is not as consistent as the CUP/CAP idea we looked at earlier, but again, this is raw, not modified, and not fitted to the markets that "work." You can see a pronounced tendency.
Now check this out.

This is the last five year's performance in the three indexes we track. As you can see, our average trade all significantly exceed the standard $100 slippage/commission we apply to all full contracts. This is on top of a general widespread bias we've demonstrated.
An actual valid day system? Or too good to be true (as in too cretinously simple)? Give it some thought while I hopefully find a way to combine this into an even more reliable hybrid. Stay tuned.
P.S. I'd love to receive feedback from you. Please leave a comment or discuss the article by clicking on "Make a comment on this article" below.
Art Collins is the author of Market Beaters, a collection of interviews with renowned mechanical traders. He is currently working on a second volume. E-mail Art at artcollins@ameritech.net.