| The Wagner Daily ETF Report For February 7 |
| By Deron Wagner |
Published
02/7/2013
|
Stocks
|
Unrated
|
|
|
|
The Wagner Daily ETF Report For February 7
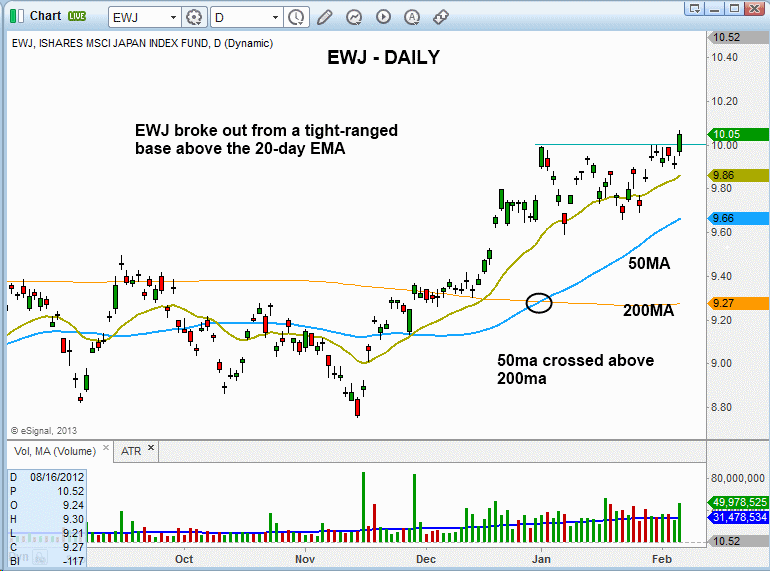
Yesterday, iShares MSCI Japan Index ($EWJ) broke out above resistance from a four-week base of consolidation. Volume also increased, confirming the move. This is shown on the daily chart of $EWJ below:

Notice how the price action held above the rising 20-day exponential moving average (beige line), while also setting "higher lows" within the base. Another positive technical indicator is that the 50-day moving average (teal line) has crossed above the 200-day moving average (orange line), signaling that momentum on the daily chart is beginning to build and the ETF is now in a clear uptrend.
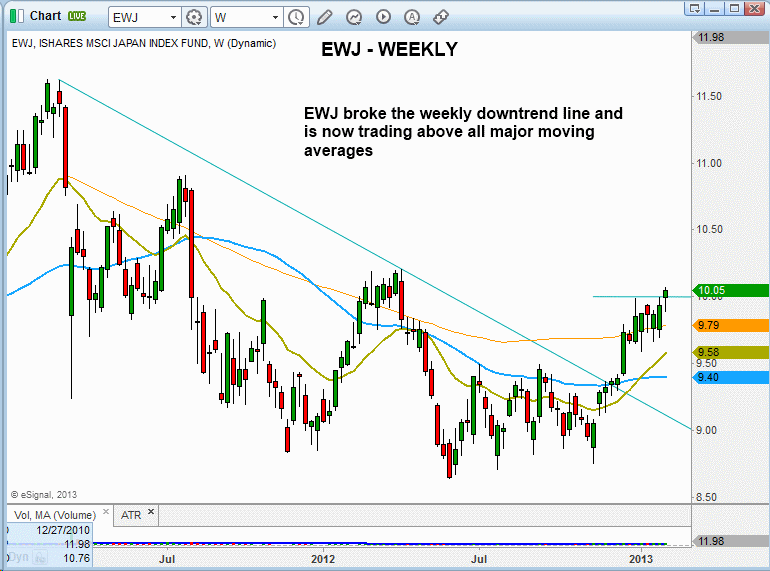
The longer-term weekly chart of $EWJ puts the recent breakout into perspective. After clearing resistance of a nearly two-year downtrend line and breaking above the base at the lows (around $9.50), $EWJ rallied and initially stalled out just below the highs of 2012. As such, the current consolidation is the first true base off the lows. We look for the price action to hold above $10.00, and subsequently test the swing high of July 2011, which is around $11.00. The weekly chart is shown below:

Going into today, $EWJ has been added to our ETF watchlist as a swing trade setup for potential buy entry if it meets our predetermined criteria. Regular subscribers of our momentum trading newsletter should note our exact entry, stop, and target prices for this trade setup in the watchlist section of today's report. Additionally, members should note our new pullback buy setup in iShares Dow Jones US Home Construction ($ITB).
Deron Wagner is the Founder and Head Trader of both Morpheus Capital LP, a U.S. hedge fund, and MorpheusTrading.com, a trader education firm.
|