The iShares Dow Jones US Home Construction ($ITB) broke out from a bullish base on January 2 and rallied about 10% higher, before stalling out just below the $24.00 level. After pulling back for two weeks, the ETF found support at its 20-day exponential moving average, which led to another move back to the prior highs. Now, $ITB is once again pausing at resistance of the $24 area:

Stocks and ETFs that find support at the 20-day EMA within a strong uptrend do not always break out to new highs immediately on the next move out. Sometimes they may need another week or two of consolidation before resuming the uptrend. As such, the price action in $ITB remains bullish, just as long as the ETF continues to set higher lows while consolidating. If $ITB stalls out at nears its current highs and pulls back in, we may be able to grab a low-risk pullback entry off another test of the 20-day EMA, around the $22.75 to $23.00 area.
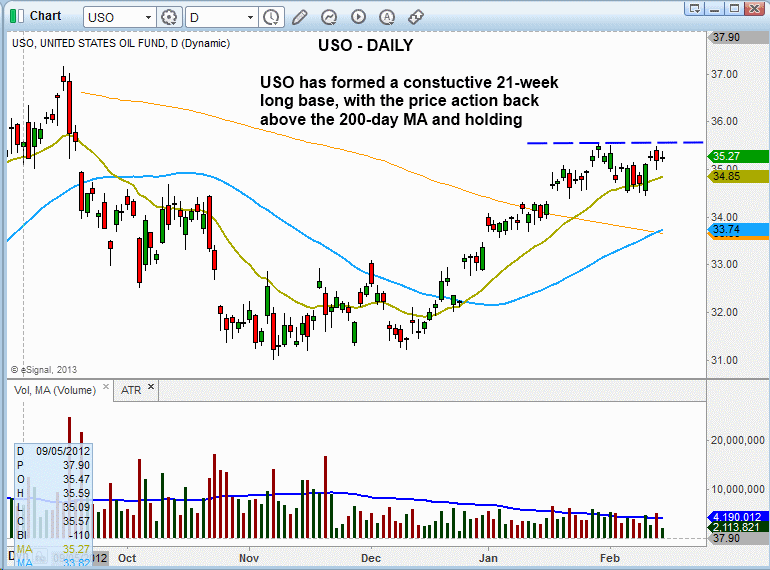
After a 25% rally off the lows last summer, the United States Oil Fund ($USO) formed a bullish base over the following five months. $USO reclaimed support of its 50-day moving average in late Decemberof 2012, as it broke out above the short-term downtrend line. Over the past several weeks, the commodity ETF has been setting higher swing highs and lows before stalling out around $35.50:

When a stock or ETF emerges off the lows of a basing pattern, it begins to form the "right side" of the chart pattern. The left side is the decline off the highs, with a series of "lower highs" and "lower lows" and the price action trending lower below the 50-day MA. Once the price bottoms out for several weeks and is finally able to set a higher swing low, the right side of the base forms, which usually leads to a series of higher highs and lows above the 50-day MA.
As we see on the daily chart above, $USO is building bullish momentum, with the 50-day MA (teal line) now in an uptrend and crossing above the 200-day MA (orange line). Ideally, the price action should trade around the $34.30 to $35.50 area for another week or two before breaking out. We will continue to monitor the action for a reliable entry point, and will be sure to alert regular subscribers of our short-term trading newsletter if the setup meets our strict technical criteria for swing trade buy entry.
Deron Wagner is the Founder and Head Trader of both Morpheus Capital LP, a U.S. hedge fund, and MorpheusTrading.com, a trader education firm.