| The Wagner Daily ETF Report For March 11 |
| By Deron Wagner |
Published
03/11/2013
|
Stocks
|
Unrated
|
|
|
|
The Wagner Daily ETF Report For March 11
With our stock and ETF swing trading strategy (overview here), there are three main types of trade setups we take: breakouts above consolidation, pullbacks to near-term support (in uptrending stocks), and trend reversals. In healthy markets, we primarily focus on buying breakouts and pullbacks. However, we occasionally spot low-risk trend reversal setups, which often offer a very positive reward to risk ratio.
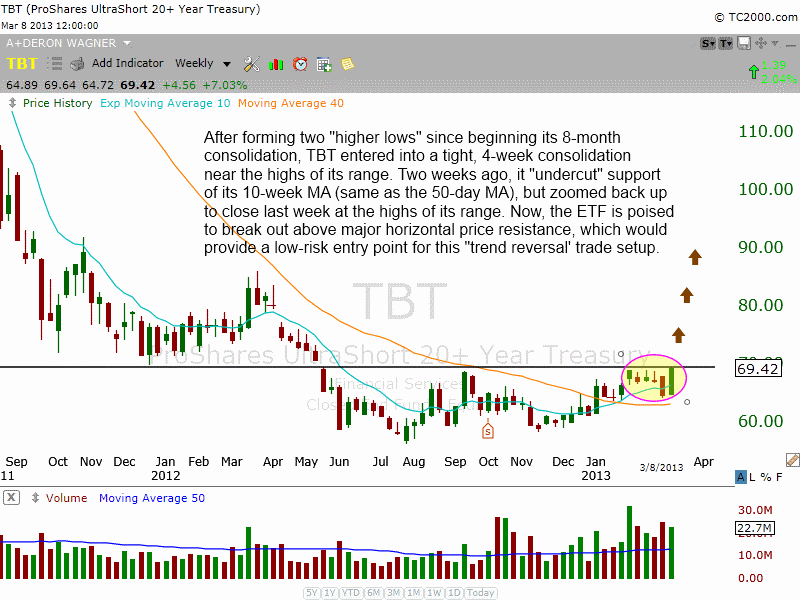
There are two new "official" ETF swing trade setups we are targeting for potential buy entry going into today's session, both of which are trend reversal plays. The first is ProShares UltraShort 20+ Year Treasury Bond ETF ($TBT). The technical criteria for this setup is detailed on the weekly chart below:

Buying a trend reversal does NOT mean "bottom fishing," which is akin to catching a falling knife. Rather, the stock or ETF must first indicate a high likelihood that a significant bottom has already been formed. For this, we specifically look for the stock or ETF to both trade in a sideways consolidation pattern for at least several months. More importantly, it must also form at least one "higher low" within that consolidation period (two is preferable).
Additionally, we always make sure the 10-week moving average (same as the 50-day moving average) has crossed above the 40-week moving average (same as 200-day moving average), which confirms the bearish momentum has reversed. Then, we buy the stock or ETF when it breaks out above the highs of its consolidation (horizontal price resistance).
As you can see on the chart above, $TBT meets all of these qualifications for a trend reversal play. The ETF has been consolidating in a sideways range since June 2012, and has formed two "higher lows" since then (November 2012 and February 2013). Then, after four weeks of tight consolidation near the high of its range, the ETF "undercut" support of its 10-week moving average just two weeks ago, but zoomed right back up to close at the highs of its range last week. Such price action is bullish and often precedes major breakouts.
Unlike the majority of our swing trade setups, in which the holding period is usually around two or three weeks, note that $TBT is intended to be an intermediate-term trade. This means we intend to hold the ETF for one to three months (assuming the price action remains healthy). Throughout that period, our plan is to trail a protective stop higher, in order to lock in profits along the way. So, for those of you who prefer longer holding periods, this may be an ideal trade setup for you. Members of The Wagner Daily technical trading newsletter should note our predefined and exact entry, stop, and target prices for this trade setup on the "watchlist" section of today's report.
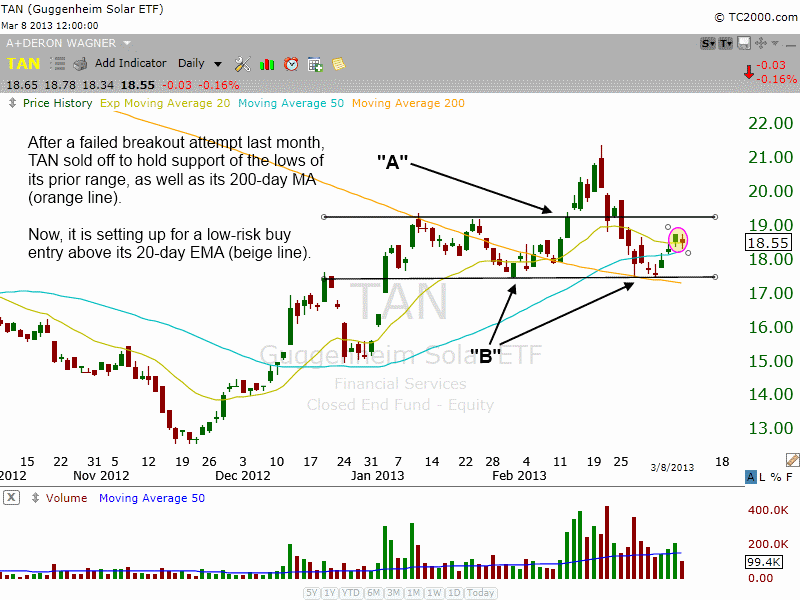
The second ETF trend reversal setup we are stalking for potential buy entry today is Guggenheim Solar ETF ($TAN). Like $TBT, this ETF meets the same trend reversal requirements on its weekly chart interval. However, it's actually the daily chart pattern that makes this trade setup enticing. Take a look at the chart below:

In mid-February, $TAN attempted to break out above a five-week base of price consolidation (point "A"). However, the breakout failed, causing the ETF to fall back to the lows of its range (point "B") less than two weeks later.
If you are new to trading, you may understandably assume failed breakouts are a bad thing. But the reality is that failed breakouts that hold support of the prior range often lead to some of the most explosive breakouts on the second breakout attempt. Since many traders buy the initial breakout attempt, then quickly sell when the breakout fails, it has the effect of absorbing overhead supply. In turn, this makes it easier for the stock or ETF to zoom higher on its next move up.
In the case of $TAN, we like that the ETF firmly found support at the lows of its prior range, which has conveniently converged with major support of its 200-day moving average (orange line). If this ETF triggers for buy entry, bullish momentum should cause it to surge above last month's high shortly thereafter. Again, Wagner Daily subscribers should note our detailed parameters for this trade setup on today's watchlist.
Deron Wagner is the Founder and Head Trader of both Morpheus Capital LP, a U.S. hedge fund, and MorpheusTrading.com, a trader education firm.
|