| The Wagner Daily ETF Report For March 12 |
| By Deron Wagner |
Published
03/12/2013
|
Stocks
|
Unrated
|
|
|
|
The Wagner Daily ETF Report For March 12
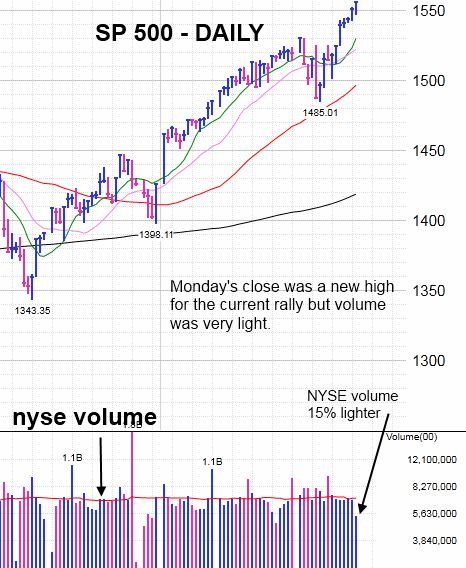
The S&P 500, Nasdaq Composite, S&P Midcap 400, and Dow Jones Industrials ended the session at a new closing high for the current rally on Monday. But while the market pushes higher, we continue to see problems under the hood. Volume was heavier on the Nasdaq, but 15% lighter on the NYSE. The light volume move to new swing highs on the S&P 500 is not a good sign for the bulls. Aside from the heavy volume gap up to new swing highs on March 5, NYSE volume has been disappointing during the the current bounce off the swing low. While price action is always king, the light volume does not sit well with us:

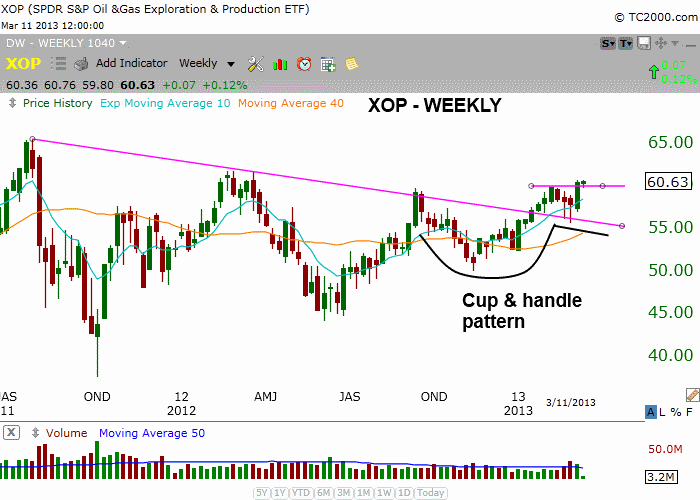
Along with financials, energy stocks have led the S&P 500 higher the past several weeks. The weekly chart below of the SPDR S&P Oil & Gas Exploration & Production ETF ($XOP) shows a bullish cup and handle pattern that is nearly complete. A close above the high of last week's candle in the next few weeks will produce a swing trade buy signal:

The price action in $XOP has tightened up nicely since last September. We also like the bullish crossover in the moving averages, with the 10-week MA now clearly above 40-week MA, and both averages are now trending higher.
Guggenheim Solar ETF ($TAN), which we discussed in yesterday's ETF trading commentary, closed below the 50-day MA yesterday, but the buy setup is still in play. If $TAN is unable to recapture the 50-day MA within a few days, then it may have to sell off to the 200-day MA and build a full basing pattern, which is at least 7 weeks in length (from the high of February 20).
Deron Wagner is the Founder and Head Trader of both Morpheus Capital LP, a U.S. hedge fund, and MorpheusTrading.com, a trader education firm.
|