| The Wagner Daily ETF Report For March 20 |
| By Deron Wagner |
Published
03/20/2013
|
Stocks
|
Unrated
|
|
|
|
The Wagner Daily ETF Report For March 20
Stocks sold off moderately on increased volume yesterday, producing a bearish "distribution day" for the Nasdaq and S&P 500. The only positive to come out of yesterday's selling was that buyers once again stepped in during the last 90 minutes of trading to lift the major averages off the lows of the day.
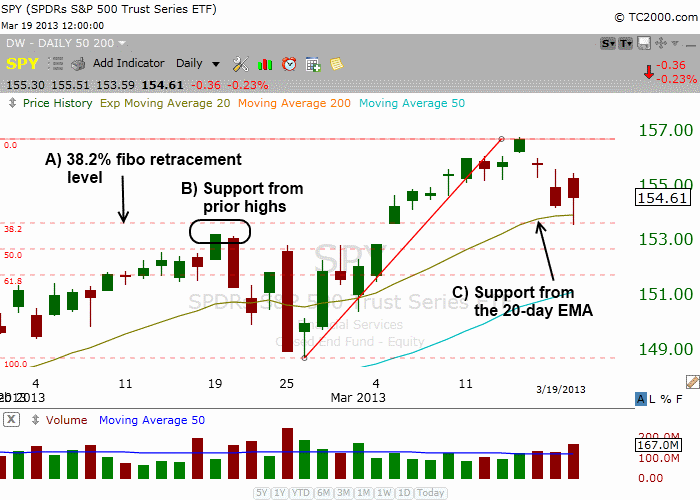
Looking at the current technical state of the S&P 500 SPDR ($SPY), a popular ETF that tracks the S&P 500 Index, we see there is a cluster of support in the $153.00 - $154.00 area. An explanation of each technical support level is shown below the following chart:

Point A - Measuring the last rally off the lows, the 38.2% retracement level is around 153.70.
Point B - There is support from the breakout pivot area around 153.20. This is the key breakout level that should hold (allowing for 1 or 2 shakeout bars below support).
Point C - Support from the rising 20-day EMA at 154.00.
After bottoming out last summer, the iShares MSCI Israel Index ($EIS) rallied 20% off the lows, before stalling out at prior highs from April 2012. However, the price action has tightened up nicely since mid-December, while holding above the rising 10-week moving average:

The 10-week MA crossed above the 40-week MA last November, and the strong price action since then has created a wide spread in the moving averages, which is typically a bullish sign. We are monitoring the price action for a clear breakout above the range highs as a momentum swing trade buy signal, especially if the breakout holds up on the weekly chart.
Deron Wagner is the Founder and Head Trader of both Morpheus Capital LP, a U.S. hedge fund, and MorpheusTrading.com, a trader education firm.
|