| The Wagner Daily ETF Report For March 27 |
| By Deron Wagner |
Published
03/27/2013
|
Stocks
|
Unrated
|
|
|
|
The Wagner Daily ETF Report For March 27
Although the stock market continues to advance on light volume, it's tough to ignore the fact that charts of many leadership stocks still look good. Yes, we have had a few leaders break down, such as $DDD or $OCN, but the majority of leading individual stocks are still holding above their 50-day moving averages and trending higher (or forming bullish basing patterns).
As we have mentioned several times in recent weeks, the king of technical analysis is simply price action (volume is queen). Therefore, until leadership in the market starts to clearly break down, our bias must remain on the long side (albeit cautiously). With that in mind, we have several new buy setups on today's "official" watchlist of The Wagner Daily ETF and stock picking newsletter.
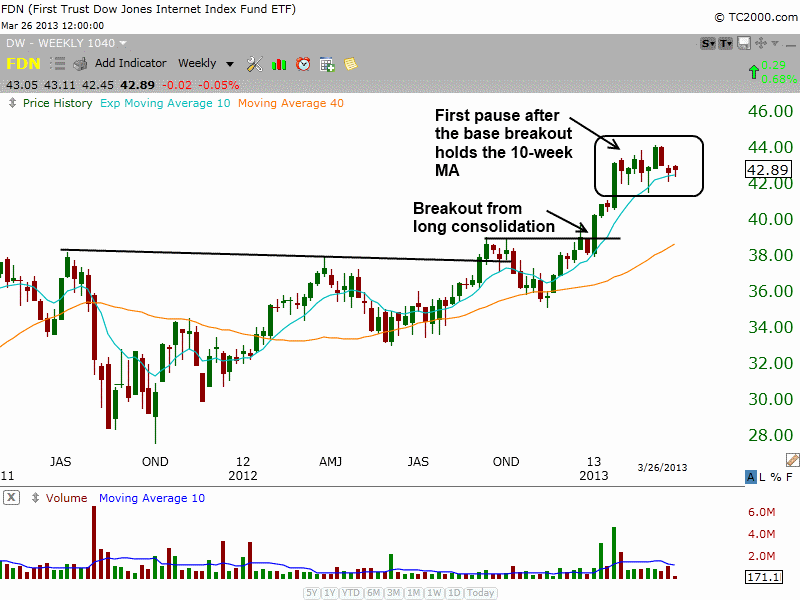
One new ETF setup is in the First Trust DJ Internet Index Fund ($FDN), which broke out from an 18-month base of consolidation in January. After stalling out around the $44 level, $FDN formed a flat base with a shallow correction, followed by a gentle pullback to the rising 10-week MA. This is the type of basing action we like to see after a breakout from a long base. This is shown on the weekly chart of $FDN below:

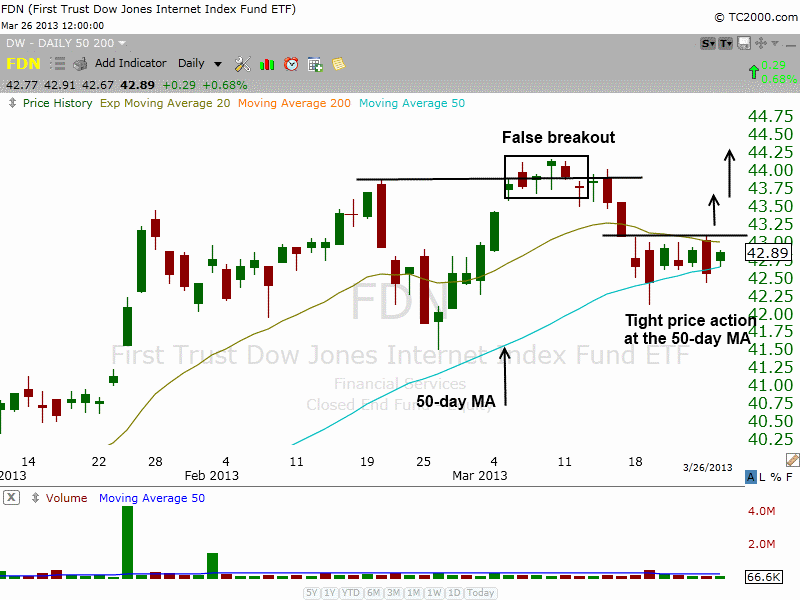
Dropping down to the shorter-term daily chart interval, we see that $FDN failed a breakout attempt in early March and sold off sharply before finding support at the 50-day MA. Since then it has formed a tight range at the 50-MA (nearly the same as the 10-week MA on the weekly chart), while setting a higher low within the base, which is bullish:

Since the daily chart of $FDN is now actionable as a potential swing trade entry, we have listed our preset trigger, stop, and target prices for this technical trade setup in the "watchlist" section of today's report. Other ETF trade setups include possibly adding to our existing open position in SPDR Oil & Gas Exploration ($XOP), as well as buying a potential continuation breakout in SPDR KBW Bank Index ($KBE). Regular subscribers should note the trade details for these new trade setups (as well as four new individual stock trade setups) going into today's session.
Navigating the market over the past few weeks has been challenging due to the mixed signals being received by our timing model. However, don't forget that price action is always king. For the moment, the market is holding up and new trade setups are emerging, both of which are bullish signs.
Deron Wagner is the Founder and Head Trader of both Morpheus Capital LP, a U.S. hedge fund, and MorpheusTrading.com, a trader education firm.
|