| The Wagner Daily ETF Report For April 2 |
| By Deron Wagner |
Published
04/2/2013
|
Stocks
|
Unrated
|
|
|
|
The Wagner Daily ETF Report For April 2
Stocks sold off sharply in the first 90-minutes of trading yesterday, before finding support around 11 am. Although the broad market slid back down in the afternoon, most of the damage was done earlier in the day. By the closing bell, the S&P 500 was down only 0.5%, but the leading small-cap Russell 2000 gave back 1.3%. Some stocks and sectors were clearly being sold, but that is bound to happen when the market rotates out of extended names. The good news is that total volume did not expand on the session, which prevented the S&P and Nasdaq from logging what would have been a fifth "distribution day" (higher volume decline).
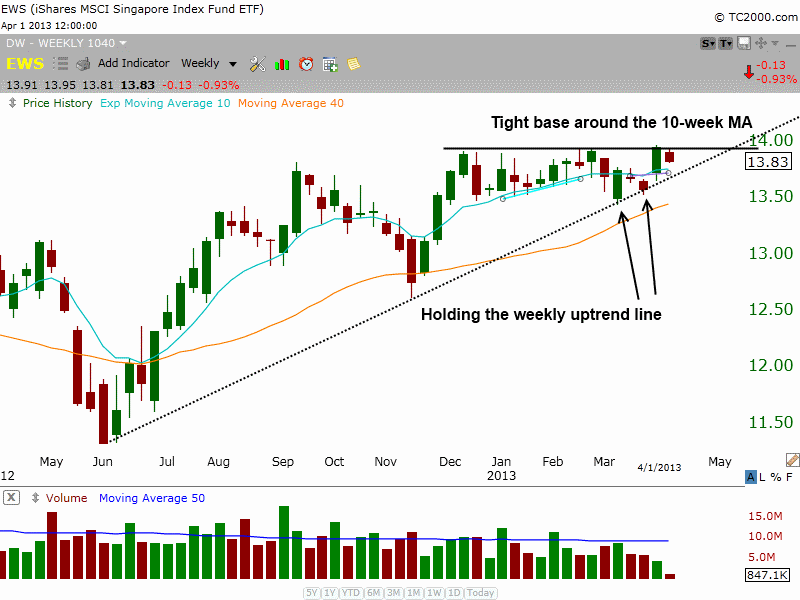
The iShares MSCI Singapore Index Fund ($EWS) continues to trade in a tight range on its weekly chart, after a shakeout beneath the lows of the range in late February/early March. The weekly chart pattern still looks good:

With $EWS, notice how the last selloff found support at the weekly uptrend line on March 4 and March 19. With the uptrend line holding intact, the current price consolidation is running out of time. This means $EWS will either need to break out above OR break down below the uptrend line within the next few weeks. An upside breakout would be a resumption of the dominant uptrend, and could create an actionable momentum swing trade setup at that time.
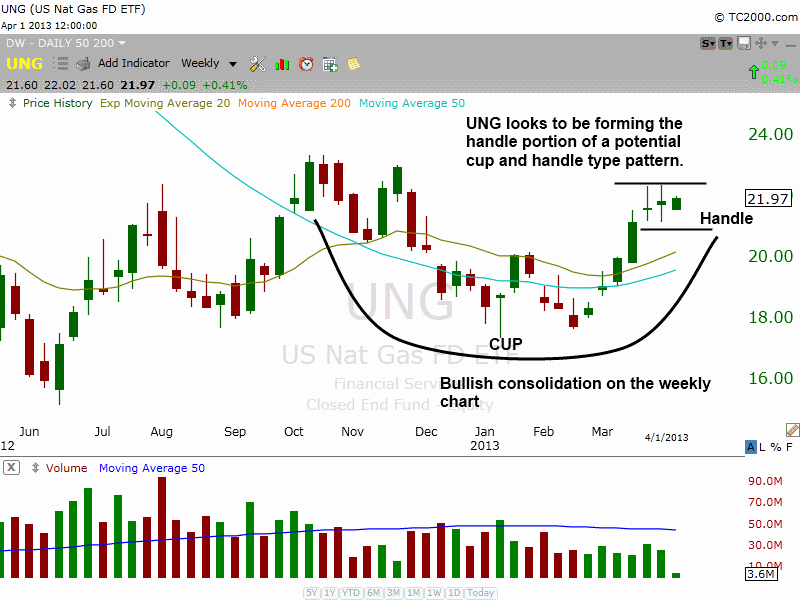
We continue to monitor United States Natural Gas Fund ($UNG), a commodity ETF that roughly tracks the price of natural gas futures, for a low-risk buy entry point. As annotated below, $UNG looks to be forming a "cup and handle" type pattern on its weekly chart:

Notice that left side of the pattern begins in November 2012, after a 60% rally off the lows. This is positive because proper cup and handle patterns should not form at or near 52-week lows; rather, there should already be an uptrend in place for a few months in order for a correct cup and handle to form.
The selloff in December 2012, as well as the bottoming action in January and February of this year, combine to form the left side and bottom of the "cup." The right side of the pattern was formed when $UNG broke out above major resistance of its 200-day moving average and rallied to the $22 area.
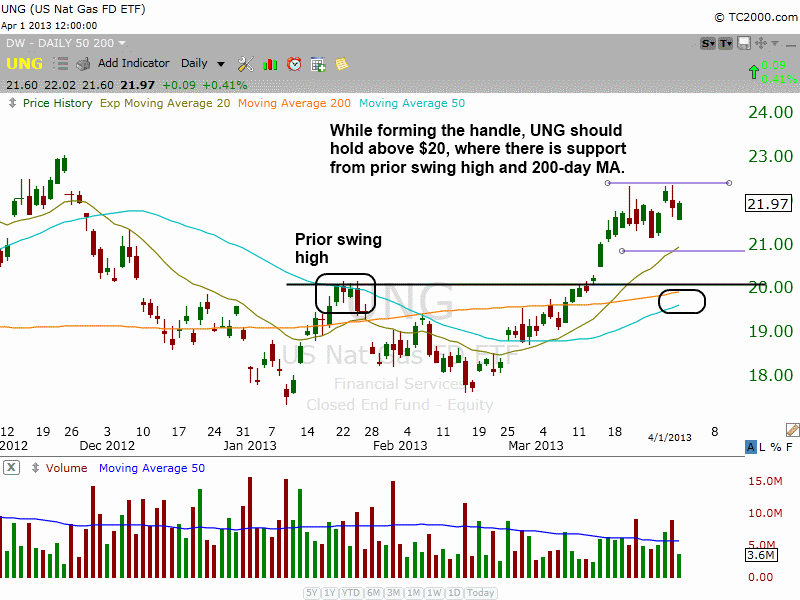
The shorter-term daily chart below shows the current "handle" portion of the pattern forming:

The handle usually takes at least a few weeks to properly develop, with the price action sloping lower and potentially "undercutting" the March 25 low. The price action itself should hold above $20 during any pullback. Otherwise, a break below that important support level could signal the pattern needs a few more months to work itself out.
Deron Wagner is the Founder and Head Trader of both Morpheus Capital LP, a U.S. hedge fund, and MorpheusTrading.com, a trader education firm.
|