| The Wagner Daily ETF Report For April 9 |
| By Deron Wagner |
Published
04/9/2013
|
Stocks
|
Unrated
|
|
|
|
The Wagner Daily ETF Report For April 9
Market conditions continue to stabilize, as stocks followed through on Friday's bullish reversal action with respectable gains across the board. Once again, the broad market averages are fighting off 5-days of distribution that produced a sell signal in our timing model. Please remember that our timing model was created to react to price action, not predict.
Whenever there are 5-distribution days in a major index and leading stocks sell off on heavy volume it it is always a major concern. However, if the market is able to fight off the distribution and BULLISH STOCK SETUPS are found, then we must buy. Sometimes it is easy to forget that we are trading stocks/ETFs and not the stock market averages.
Our scans the past few days have produced several high quality buy setups. Yesterday, we added long positions in $OIH and $UNG to the portfolio, and we have several new buy candidates on today's watchlist.
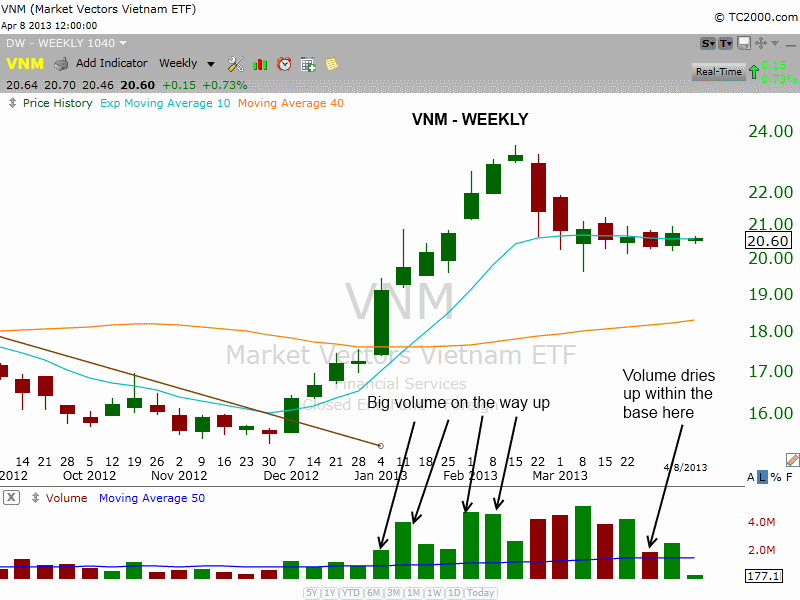
One of the best looking country ETF charts we found was the Market Vectors Vietnam ETF ($VNM). The weekly chart is quite powerful, as it shows the huge pick up in volume during the rally as the price action cleared the 40-week MA (in orange). The price action is now consolidating in a tight range around 10-week MA (teal line). Note the dry up in volume two weeks ago, which indicates that investors have lost interest in trading $VNM as it continues to base out (bullish):

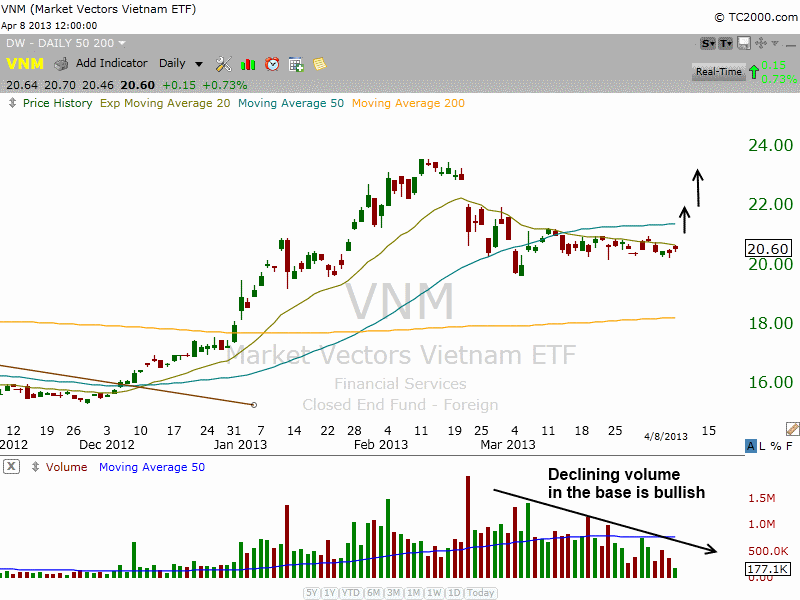
The daily chart in $VNM shows the tight price range just below the 20-day EMA. We can easily see the nice drop off in volume since March 27 as well. A break above the three-day high is our buy entry, as this would put the price action above the 20-day EMA and the short-term downtrend line of the tight range. A break above $21 would also confirm that a higher swing low is in place on the daily chart:

Deron Wagner is the Founder and Head Trader of both Morpheus Capital LP, a U.S. hedge fund, and MorpheusTrading.com, a trader education firm.
|