| The Wagner Daily ETF Report For April 10 |
| By Deron Wagner |
Published
04/10/2013
|
Stocks
|
Unrated
|
|
|
|
The Wagner Daily ETF Report For April 10
Our timing model generated a sell signal on close of April 3. However, since that sell signal, leading stocks have held up quite well (as have the major averages after the bullish reversal on April 5). New buy setups also continue to emerge.
Because of this, we are now shifting the market timing system into "neutral" mode. A close above range highs in the S&P 500 would put the model back in "buy" mode, while a clear breakdown below the 50-day moving average on the S&P 500 and Nasdaq Composite would force the model back onto a "sell" signal.
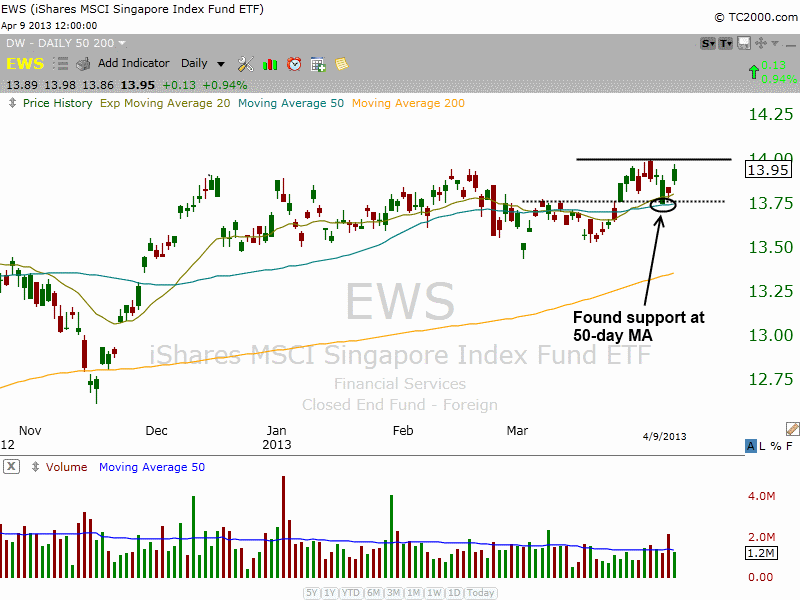
iShares MSCI Singapore Index Fund ($EWS) is back on our watchlist after a failed breakout attempt last February. Since then, the price action has undercut the 50-day moving average and popped back above it. After another false breakout attempt on April 3, $EWS found support from the rising 50-day MA and prior swing high (dotted black line), around $13.75. The daily chart of $EWS is shown below:

When possible, it is important to have multiple time frames confirming a potential trade (on recent IPOs we can't). This means that we like to see something interesting happening on the weekly or monthly charts to support our analysis on the daily chart. That also goes for intraday charts, as the majority of our buy entries are placed above all major moving averages on the 5, 15, and 60-minute time frames.
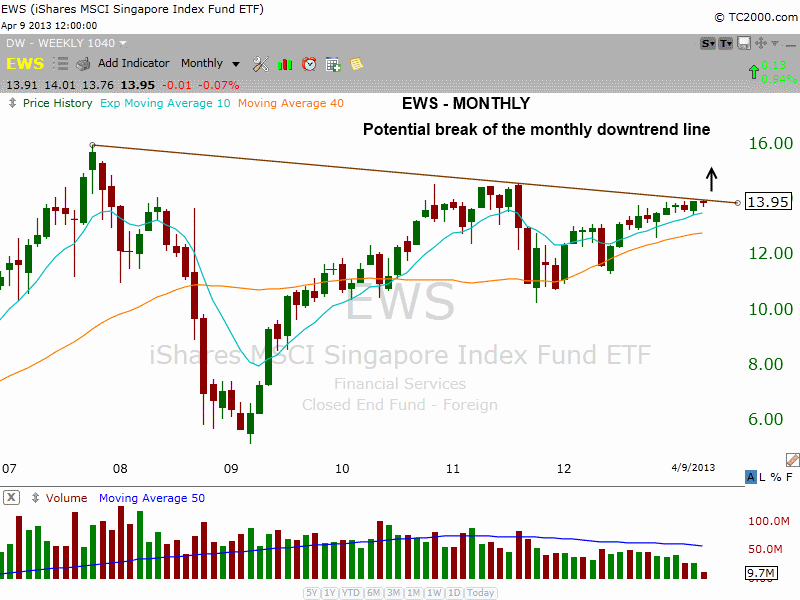
With $EWS, the monthly chart below shows a downtrend line in place with multiple touches of the anchor points. A breakout above the high of the current range should lead to a breakout above the monthly downtrend line:

As always, we will notify regular subscribers of The Wagner Daily swing trade newsletter with our exact entry, stop, and target prices if/when $EWS meets our technical criteria for a low-risk buy entry.
Deron Wagner is the Founder and Head Trader of both Morpheus Capital LP, a U.S. hedge fund, and MorpheusTrading.com, a trader education firm.
|