NASDAQ Commentary
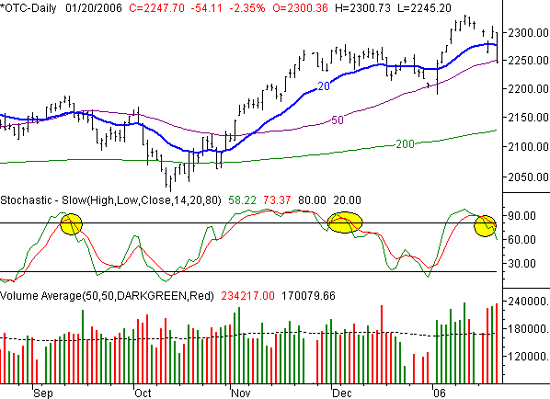
What a week. Or what a day, to be more specific. The NASDAQ Composite lost 54.11 points on Friday (-2.35%) to end the week at 2247.70. And for the week, that meant a total dip of 69.34 points (or a loss of 3%). It was also one of the wildest weeks we've seen in a while.
On Wednesday we saw a bearish gap. Then Thursday, we saw a bullish gap. Seeing one or the other wouldn't have been a huge deal, but we start to get suspicious when we see that much turbulence packed into a short period of time. Granted, a major expiration week (LEAPS expired too) cold have fueled some of the flames, but an option expiration week usually just magnifies what the market was going to do anyway. In this case, it was pointed lower, leading to one of the biggest single-day losses we've seen in years.
What does it mean now? We saw this move coming, with the VIX or VXN both coming up off of extreme lows, while the markets were just churning. However, it's unlikely that the downward move is quite over. Both the VXN and VIX are still at incredibly low levels, so more of that optimism needs to be burned off before we actually hit a bottom.
But even from a more technical perspective, things look bearish. We've made a couple of closes under the 20 day moving average (blue) this past week, although they weren't back to back. Clearly, that represents a big change of hear from what we saw in the beginning of the year. In the short-run, we have to take that at face value and get bearish. In the intermediate-term, we're still a couple of days - and a couple of chart patterns - away from turning bearish. To be specific, we'd like to see another close under the 50 day line (purple) before we're convinced that the intermediate-term momentum is to the downside. The NASDAQ's close at 2247.70 is just a hair under the 50 day line at 2249.74. A close under 2247.70 will be all the convincing we need.
In the meantime, we have a complete stochastic sell signal, where both the %K and %D liens are now back under 80. Plus, last week, we saw the distribution effort really start to grow. That just means the bearish volume bars are starting to get taller. This is typically an omen that the institutions are starting to shed stocks.
Let's set support at 2126, where the 200 day average is. Resistance is at the 20 day line, or 2277.70. But, keep in mind that the first day back from expiration (Monday) could get wild, especially after the composite got crushed last week. Don't get fooled by a little buying.
NASDAQ Composite Chart - Daily

S&P 500 Commentary
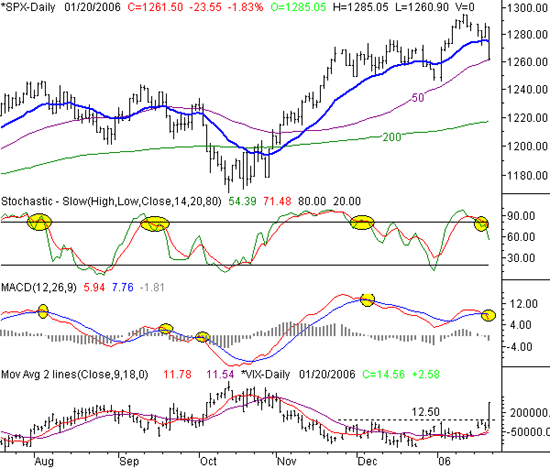
Things weren't quite as bad for the S&P last week. It lost 23.55 points on Friday (-1.85%) as part of a 26.1 point drop for the week, to close at 1261.50. In the process, we got a handful of sell signals that we're heeding. Namely, a MACD crossunder and a stochastic sell signal. Prior instances of both signals are highlighted on the chart, and as you can tell, they're pretty accurate. That's why we're in the bearish camp this time around.
However, we do see a glimmer of hope on this chart that we didn't see for the NASDAQ. The close at 1261.50 is basically right at the 50 day line. If the 50 day average truly is regarded as support for the SPX, then the selling is now over. The thing is, why didn't the NASDAQ find support at its 50 day line? In general, the NASDAQ leads the other indices - both up and down - which is why we're taking our cure from the NASDAQ chart. If you're a die-hard disciplined trader, the S&P 500 will be in bearish mode with the second close under 1261.28.
In the lowest portion of the chart we've plotted the CBOE Volatility Index. For weeks, the 12.50 area has been resistance, staving off a selling spree like the one we saw on Friday. No more. The VIX's close at 14.56 marks a major shift in the way people are thinking, which should accompany a shift in the overall market momentum. Yes, as we already mentioned, a major expiration day probably skewed the VIX reading, but the damage that was done now can' t be undone, regardless of the reason. We're looking for the VIX to keep rising now that the barrier has been broken. The same goes for the market, but the pressure will be to the downside.
As for a landing spot, the 200 day line is at 1217 and rising. That seems miles away (and is), but that's the price you pay for an unchecked rally like we saw in early November and early January. Resistance is at 1275.
S&P 500 Chart - Daily

Price Headley is the founder and chief analyst of BigTrends.com.