| The Wagner Daily ETF Report For May 3 |
| By Deron Wagner |
Published
05/3/2013
|
Stocks
|
Unrated
|
|
|
|
The Wagner Daily ETF Report For May 3
The current market rally continues to build steam, led by the relative strength in the Nasdaq Composite, as it pulls away from the 3,300 breakout level. The Nasdaq rallied 1.3% on Thursday, and is the only index to have broken out to new swing highs. The S&P 500 rallied 0.9%, and the Russell 2000 closed back above the 50-day MA with a solid 1.7% advance. Volume was light on both exchanges, which prevented the averages from logging an official "accumulation day," but we saw plenty of solid buying in leading stocks.
Natural Gas ETF ($UNG) was hit hard on Thursday, dropping 6% on heavy volume. With the price action breaking the bullish reversal candle low of 4/26 and the 20-day EMA, $UNG may need a few more weeks of consolidation before it can head higher. There is support from the 10-week moving average on the weekly chart below. The 50-day MA on a daily chart is slightly lower at 21.42.
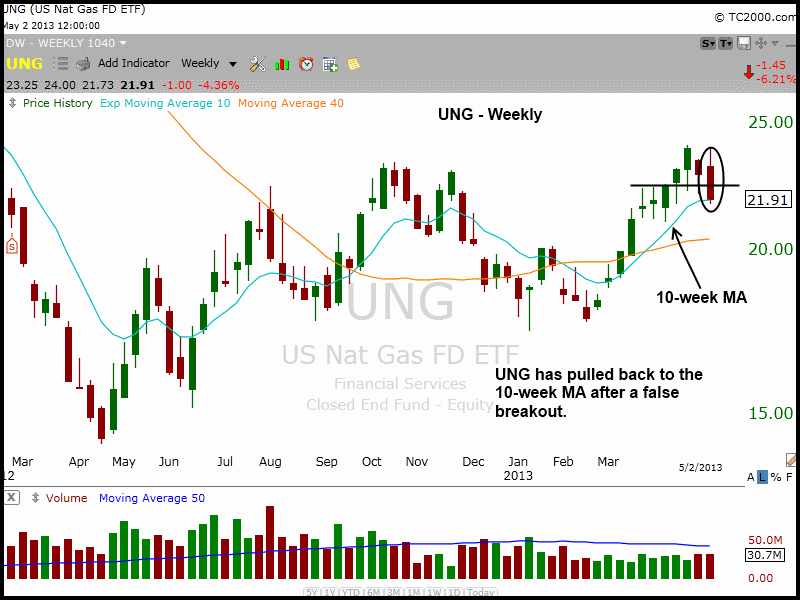
We entered the trade based on the weekly chart, and although we monitor price action all day, it sometimes pays to take a step back and focus on the bigger picture. $UNG's chart remains intact, but we certainly would like to see the price action hold above $21 and set a higher swing low on the weekly chart. The 10-week crossed above the 40-week MA a few weeks ago, which is bullish trend reversal signal. We must be patient here and let the new uptrend develop.
$SMH continues to act well, but is a bit extended from the 20-day EMA and could be due for a short-term pullback. We bought $SMH based on a long-term downtrend line breakout, so we are not looking to take profits on the first move after the breakout.
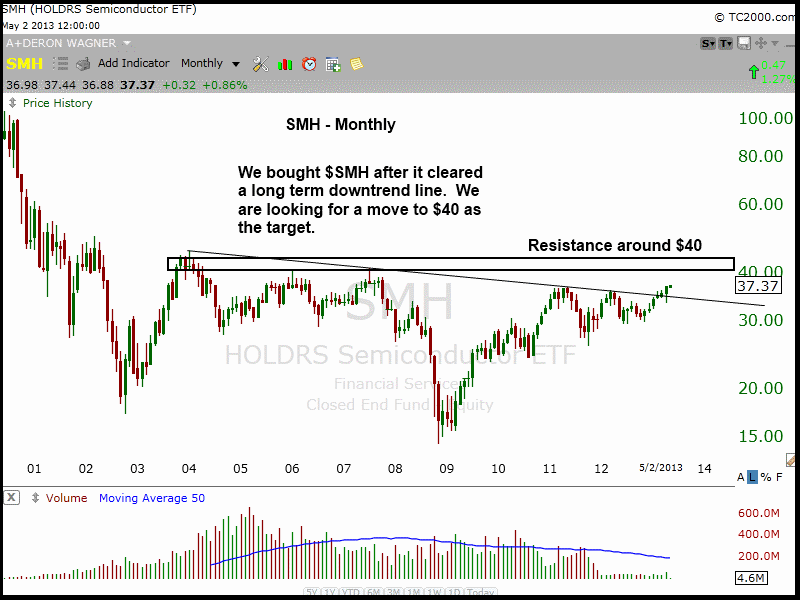
Although $SMH is extended in the short-term, we must follow the trade plan and let the trade play out. The unofficial target for $SMH is around the $40 level, which is where we see a zone of resistance on the monthly chart above. As the saying goes, "plan the trade and trade the plan", which is much easier said than done. We all make mistakes, but those who consistently stick with the original game plan avoid acting on emotion, and that is usually when bad decisions are made.
Deron Wagner is the Founder and Head Trader of both Morpheus Capital LP, a U.S. hedge fund, and MorpheusTrading.com, a trader education firm.
|


 Free Festival of Traders Videos