NASDAQ Commentary
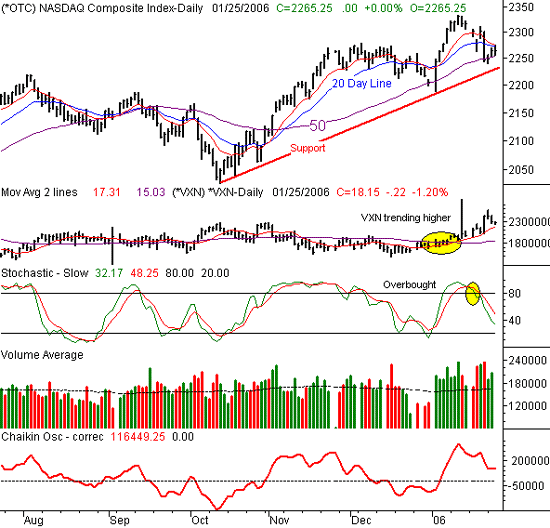
The NASDAQ Composite managed to put a quick end to its massacre we saw at the end of last week by logging a couple of modestly bullish sessions this week. But, even a brick will bounce if dropped from high enough. Last Friday's 3% plunge was a multi-year worst. And, coming off a very strong open at the beginning of 2006, it's not a surprise to see a few traders taking the bait - so to speak - and buy on the dip. Just keep in mind that these buyers have actually made very little progress in the first two and a half days of this week. In fact, today was their first day the bulls have been able to put any real pressure on the moving average lines we fell under last week. And so far, the results have been rather bearish. That may be an omen of what's in store.
As of right now, the NASDAQ is basically flat for the day. For the week, it's actually up by 17.5 points, or 0.78%. That's not a bad move for the bulls, but as we said above, it's not a surprising result after last week's tumble.
What we're most interested in seeing today is where we close in relation to the 10 and 20 day averages. These are the short-term signal lines, and of course, they provided a bearish signal last week when the index fell under them. As of right now, we're still under them, but we got a bearish hint earlier today when the composite pulled back after hitting the 10 day line with its high of 2275.30.
On the other hand, the 50 day average has been support for the last couple of days, and is currently at 2254.40. Proverbially speaking, the NASDAQ is caught between a rock and a hard place. And after seeing what happened at the 50 day line when 2005 turned into 2006, it's definitely worth waiting to see how all this plays out.
Also coming into play is that support line (red) that extends all the way back to October. We've adjusted it slightly (lower) to include the low of 2189.91 on January 2nd. That leaves it about 15 points under the 50 day average, as it was on January 2nd. Just think of it as a cushion. If we break under that support, then we can expect thing to really get bearish. Anything other bearish pattern besides that would be questionable at best.
That said, we still have a handful of firm bear signs....a rising VXN, a stochastic sell signal, and a MACD crossunder (not shown). Although we're being cautious because of that support line, our expectation remains a bearish one.
NASDAQ Chart

S&P 500 Commentary
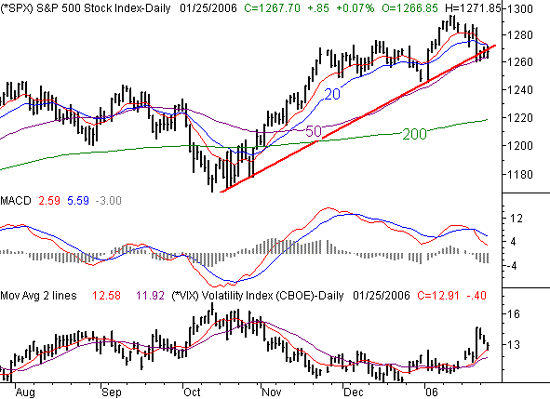
The S&P 500 is pretty flat today too, which may be a sign that we're already transitioning back into a bearish mode just a couple of days into the modest buying mode. For the week, we're up 6.2 points, or 0.5%. And like the NASDAQ, the SDPX is trapped squarely above the 50 day average, and below the 10 day line. In fact, the high of 1271.85 and the low of 1263.60 today has spanned the entire gap between those tow moving average lines. Clearly, something has to give soon. What's interesting here is that the 50 day line has been perfect support for the S&P 500 since Friday's freefall. Technically speaking, we'd have to say that kind of consistent support suggests bullishness.
On the other hand, the support at the 50 day line hasn't really helped the bulls much yet. The buyers will only knock on that door so many times - if it goes unanswered, they'll move on. In other words, support at the 50 day line is not enough to inspire buying. If we don't see enough strength to get back above the 10 day line soon, then the 50 day line will buckle as support (traders can't tolerate stagnation).
We're in the bearish camp based on this chart too. The same support line applied to the NASDAQ has already been breached here, so the 50 day average really is the last straw. A couple of closes under the 50 day line will move us to a full bearish stance. We've already got some bearish indicators in place, with the MACD chart being one of them.
We've also plotted the CBOE Volatility Index (VIX) again, as it's been a key indication recently of trader's tolerance limits. The VIX surged on Friday, as you'd expect it to during a monster selloff. But since then, it has been sliding back while the market crawled forward. Some argued that the VIX had peaked in a blaze of glory on Friday, and was set to fall back again as stocks started to make gains. We acknowledge that the argument was valid, but we'll also add that the VIX (nor the market) can be assessed just based on one day. The VIX had no support until today, when it touched its 10 day line with its low of 12.63. Since then, it's moved closer to the higher end of its bar, suggesting some upward pressure for this fear gauge. At the same time, the SPX has fallen back toward the middle of its daily range. While this isn't exactly bearish, it certainly isn't bullish. That makes today an important infection point. Be sure to keep a close eye on all the support and resistance levels fir today's closing prices (the VIX too), as that will really tell us what traders plan on doing next.
S&P 500 Chart

Price Headley is the founder and chief analyst of BigTrends.com.