| The Wagner Daily ETF Report For June 5 |
| By Deron Wagner |
Published
06/5/2013
|
Stocks
|
Unrated
|
|
|
|
The Wagner Daily ETF Report For June 5
Stocks failed to follow through on Monday's bullish reversal action and sold off most of the day, with all indices closing in negative territory. A bounce in the final hour of trading allowed the averages to close off the lows of the session, but still in the bottom third (or so) of the day's range.
Lighter volume on both exchanges prevented the Nasdaq and S&P 500 from suffering another distribution day. As we have mentioned in the past, our timing model is based on the price and volume action of broad market averages and leading stocks. The volume pattern in the NYSE and Nasdaq has turned bearish over the past few weeks, which places all the burden on the leading stock portion of the model (which has held up all year). If leading stocks continue to hold up, then we would expect the current correction to be shallow or short-lived. If leading stocks break down en masse, then we could potentially see a deeper correction.
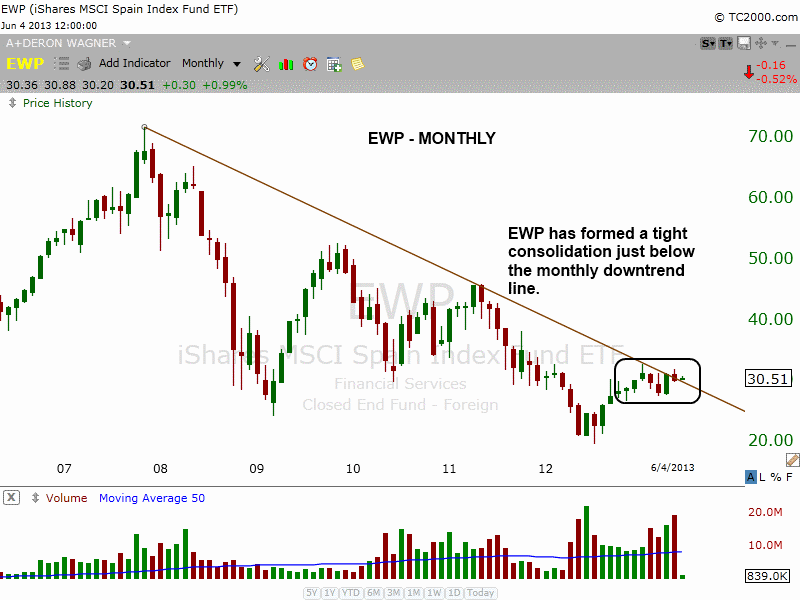
While many Pacific Rim ETFs have taken a beating the past few weeks, we are seeing some stability from Europe with the iShares MSCI Spain ($EWP) consolidating above its 50-day moving average on a daily chart. The monthly chart below shows $EWP trading just below the downtrend line:

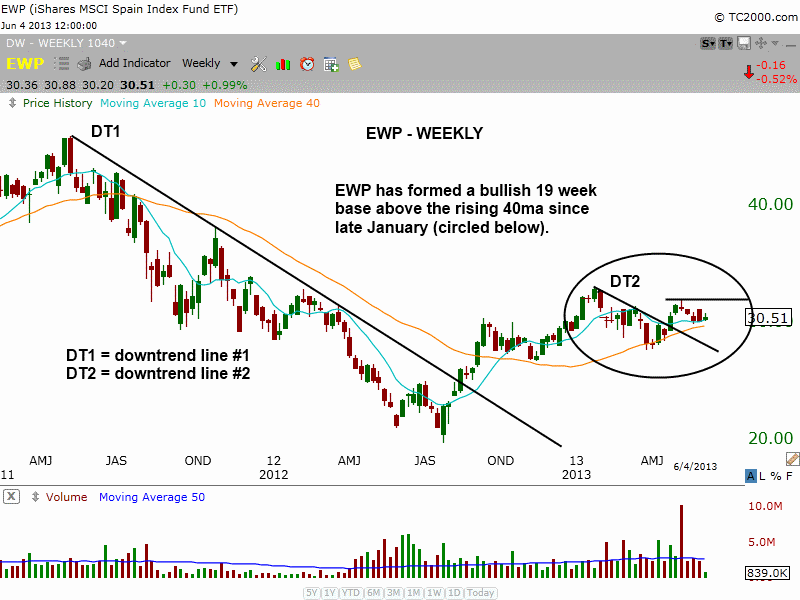
The weekly chart below shows the recent strength in $EWP since it cleared the weekly downtrend line (DT1) last summer. After stalling out at $32 in January, the price action has pulled back to the (now) rising 40-week MA and held. Now that the short-term downtrend line (DT2) is broken and $EWP is back above the 10-week MA, we can look for the price action to tighten up and potentially form a low risk entry point in the next few weeks. A move above $33 would produce a breakout on multiple time frames (monthly and weekly), which is always a bullish sign.

Deron Wagner is the Founder and Head Trader of both Morpheus Capital LP, a U.S. hedge fund, and MorpheusTrading.com, a trader education firm.
|