| The Wagner Daily ETF Report For June 7 |
| By Deron Wagner |
Published
06/7/2013
|
Stocks
|
Unrated
|
|
|
|
The Wagner Daily ETF Report For June 7
After a tough two and a half day sell off, stocks staged an impressive recovery Thursday afternoon, with all major averages closing more than 1.0% off the lows of the day and in positive territory. Turnover failed to confirm the move, as volume was lighter across the board. Although the light volume was a bit of a disappointment, we are more concerned with the averages finding some traction in the short term (volume can always come in one or two weeks after a bottom is in place).
We are not ready to call a bottom in the market, but Thursday's action was a good start. Our timing model remains in buy mode, but there are very few (if any) actionable setups in A rated stocks or top relative strength ETFs that are ready to break out within the next few days. Patience is key as we wait for new buy setups to develop.
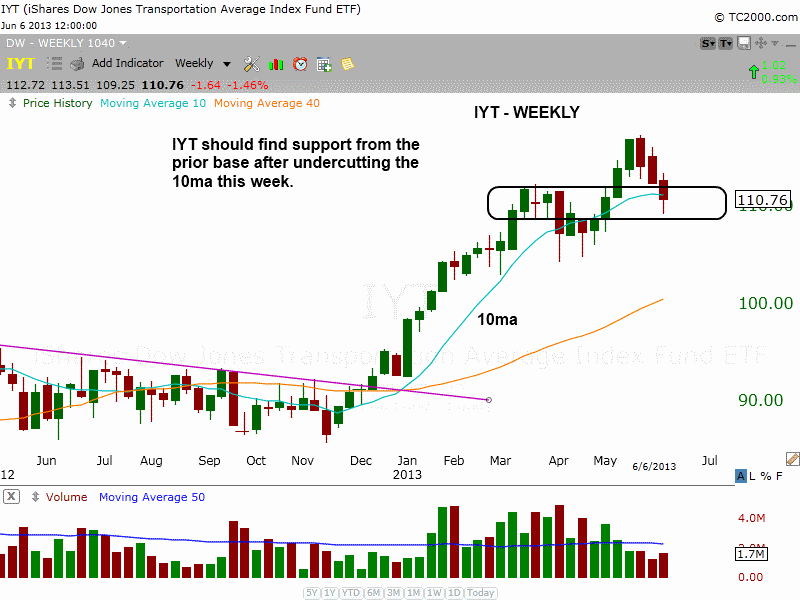
When the market is in pullback mode within a strong uptrend, prior bases in stocks and ETFs should serve as a logical support area. The recent pullback in $IYT is a good example of a prior base that should provide support. The recent breakout in $IYT stalled in mid-May, so the current pullback should find support from the upper half of the last base and the rising 50-day MA.

$IYT is not actionable for us at current levels, but if the price action can consolidate for 2-3 more weeks above the 50-day MA, then a low risk buy point could emerge.
On the weekly chart below, note the big pick up in volume over several weeks as the Market Vectors Vietnam ETF ($VNM) rallied from last December to February. After a two month long correction to the 40-week MA, the price action stabilized and rallied back above the 10-week MA.

Dropping down to the daily chart, we see that $VNM has broken the downtrend line of the consolidation and is now back above the 50-day MA. Since reclaiming the 50-day MA, the price action has set a few higher swing lows. $VNM could potentially undercut the last swing low and touch the 50-day MA, but as long as support holds at the 50-day MA the setup is still intact.

The ideal buy entry in $VNM is on a breakout above the current swing high at $21.50. Depending on the price action over the next week or two, an earlier entry point could develop. On an early entry we usually take partial size and look to add the rest on a breakout above the swing high.
Deron Wagner is the Founder and Head Trader of both Morpheus Capital LP, a U.S. hedge fund, and MorpheusTrading.com, a trader education firm.
|