- Market: May 2006 Sugar (SBK6)
- Tick value: 1 point = $11.20
- Option Expiration: 04/13/06
- Trade Description: Bear Put Spread
- Max Risk: $560.00
- Max Profit: $1680.00
- Risk Reward ratio 3:1
Buy one May 2006 Sugar 1650 put, while selling one May Sugar 1450 put, on the same ticket, for a combined cost and risk of 50 points ($560.00) or less to open a position.
Technical/Fundamental Explanation
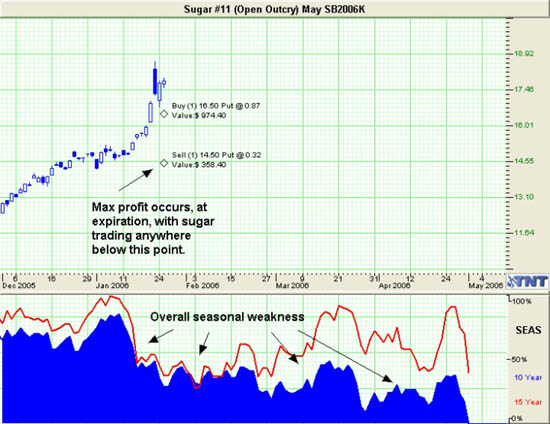
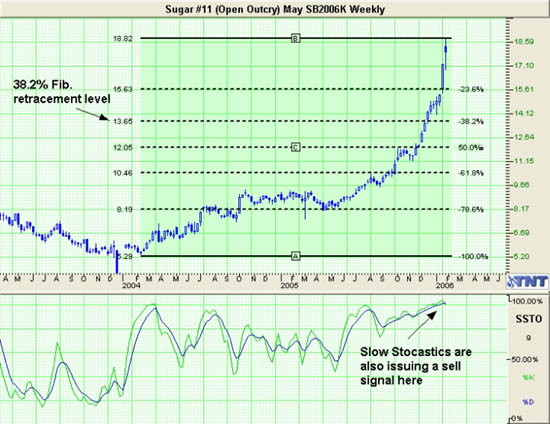
Sugar has seen a very strong start to 2006. This was not much of a surprise considering where energy prices have gone in the same period. Sugar is a partial energy contract. This is because as the price of crude oil climbs people begin to seek alternatives and one major alternative is ethanol. Ethanol can be produced from sugar. For example, India is a large producer of sugar. Last year 55% of all the sugar produced in India went to the production of Ethanol. On January 22, Bloomberg reported: "Sugar prices surged to a 24-year high as more supplies are used for fuel because of soaring energy costs. . .Sugar has jumped 92 percent in the past year as Brazil, the world's biggest producer and exporter, converted more of its crop into ethanol fuel to cope with record gasoline prices. . . " While this may sound like a bullish argument, it is not. It was a bullish argument when sugar was trading around 10 -11 cents but now at 18 cents we have seen a solid run already. Elliot Wave theorists contend that a market move that is greater or less than a 45 degree angle cannot sustain itself for very long. As you can see on the charts below the Sugar market has recently gone almost vertical! This should be the first sign that we are nearing a temporary top. Also notice that a Fibonacci retracement of only 38.2% would have sugar trading near 13.65 which would be well below the max profit on this particular trade. Seasonally Sugar tends to drop from late January into May. This trade is a simple bear put spread that gives traders 3 to 1 on their money while keeping overall risk both low and clearly defined. ***the first chart below is daily data while the second chart is weekly data.
Daily
Weekly
Profit Goal
Max profit assuming a 50 point fill is 150 points ($1680.00) giving this trade a 3:1 risk reward ratio. Max profit occurs at expiration with the Sugar trading anywhere below 1450. The trade is profitable at expiration if Sugar is trading anywhere below 1600 (break even point).
Risk Analysis
Max risk assuming a 50 point fill is ($560.00). This occurs at expiration with the Sugar trading above 1650.
Disclaimer
Past performance is not indicative of future results. Trading futures and options is not suitable for everyone. There is a substantial risk of loss in trading futures and options.
Matt Odom is the Managing Partner and Energy Analyst and Derek Frey is Head Trader at Odom & Frey Futures & Options.


 Free Festival of Traders Videos