| The Wagner Daily ETF Report For June 27 |
| By Deron Wagner |
Published
06/27/2013
|
Stocks
|
Unrated
|
|
|
|
The Wagner Daily ETF Report For June 27
Stocks rallied for the second straight day on lighter volume, with most averages closing up near 1.0% on the session. The small-cap Russell 2000 was a noticeable laggard, gaining only 0.3%; however, it was the first major index to recently test support of its 50-day MA, which produced the stalling action in the broad market.
Although our stock market timing model is in "sell" mode, the majority of leading stocks we follow have been holding up well. Along with noticing changes in volume patterns (ie. the number of "distribution days"), the performance of leading stocks is always a key factor at determining the health of a market. As such, we presently feel it is best to lay low and wait for some "accumulation days" (higher volume gains) in the broad market as a sign to enter new long positions, rather than selling short stocks and ETFs into the current bounce.
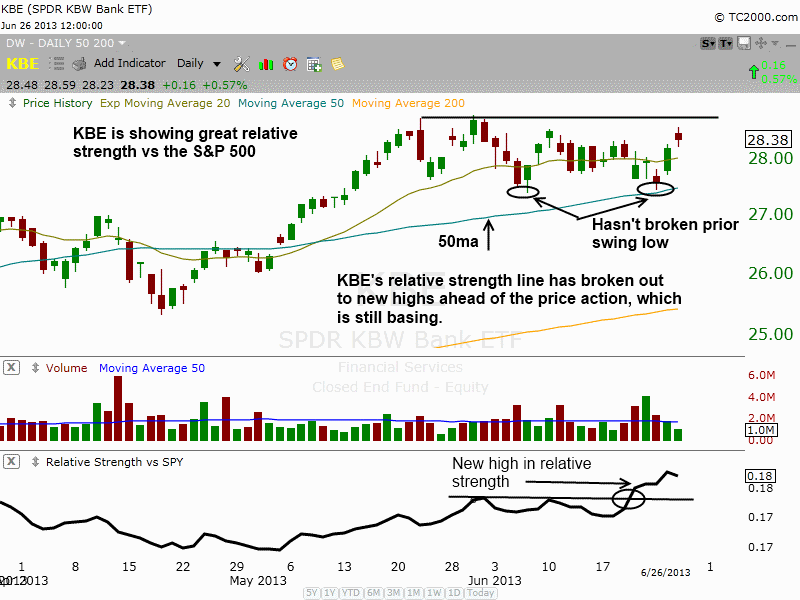
SPDR KBW Bank ETF ($KBE) continues to show great relative strength to the S&P 500, and is still holding above support of its 50-day MA. While we do not expect $KBE to break out when the market is struggling to find a bottom, we do see the strength as a positive sign. Along with iShares Broker-Dealer Index ETF ($IAI), the financials are doing their part to keep the S&P 500 in an uptrend.
On the daily chart of $KBE below, note the relative strength line that illustrates the strength of $KBE versus the S&P 500 Index SPDR ($SPY):

Looking at the chart above, the black line at the bottom measures the daily relative strength of $KBE vs $SPY. When the line is going up, $KBE is outperforming $SPY (when the line is going down, $SPY is outperforming $KBE). Notice how the relative strength line broke out to new highs ahead of actual price action, which is still trading in a tight range. This bullish divergence suggests that if/when market conditions improve, $KBE could be one of the first ETFs to break out ahead of the broad market.
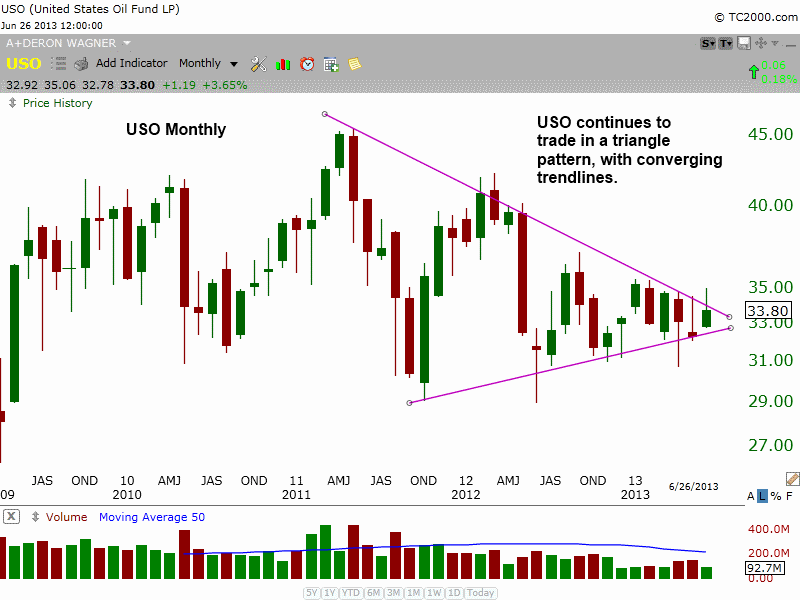
A few weeks ago, we mentioned the symmetrical triangle pattern that was near completion in United States Oil Fund LP ($USO). We attempted to buy the breakout of the downtrend line, but our trigger price for buy entry never triggered and $USO reversed lower (false breakout):

Ideally, we would now like to see $USO tighten up over the next week or two, so that we can grab a lower risk entry point with partial size, and add the rest on the break of the downtrend line. $USO has been trading in a range between $30 and $40 since 2009, so there is a possibility the pattern may simply go nowhere and just lead to further chop. Also, the pattern is running out of real estate and does not have much more time to develop (the price action is almost up to the point of the triangle).
Deron Wagner is the Founder and Head Trader of both Morpheus Capital LP, a U.S. hedge fund, and MorpheusTrading.com, a trader education firm.
|