Weekly Chart Analysis: NZD/JPY Large Triangle Setup
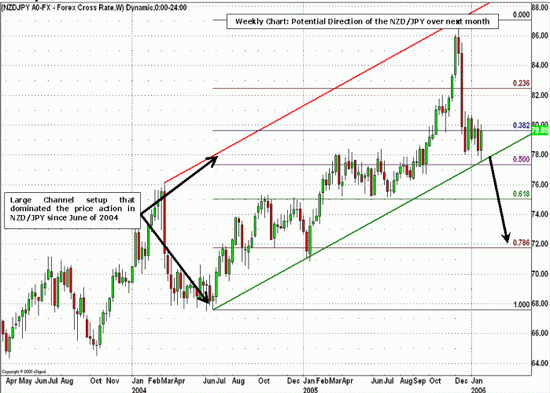
- NZD/JPY continues to trade within a Large Channel
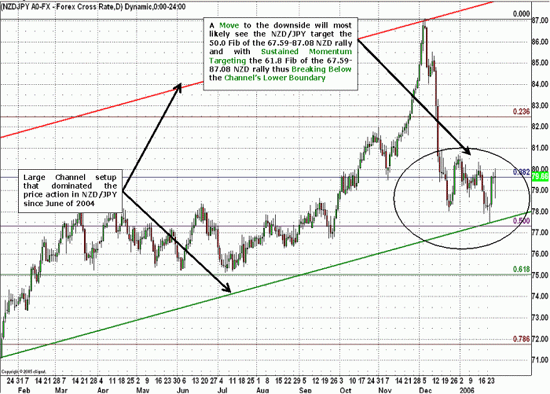
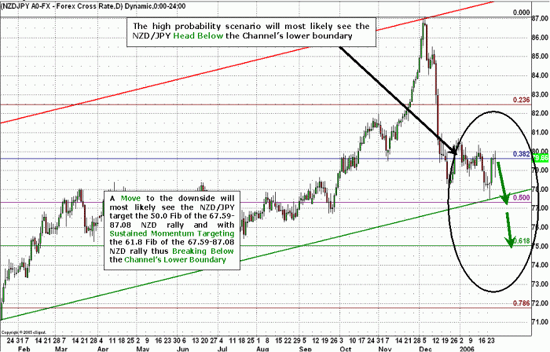
- High probability setup points to a possible move below the channel's lower boundary
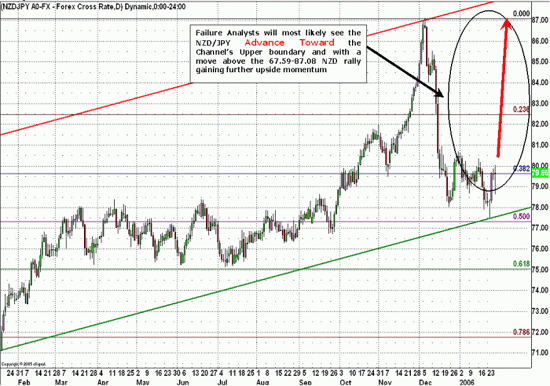
- Failure analysis points to a move toward the channel's s upper boundary
Key Levels - Current Price: 79.69
Level Type Significance
87.09 Resistance 2005 High
82.48 Resistance 23.6 Fib of the 67.59-87.08 NZD rally
79.63 Resistance 38.2 Fib of the 67.59-87.08 NZD rally
77.33 Support Channel's Lower boundary and 50.0 Fib of the 67.59-87.08 NZD rally
75.03 Support 61.8 Fib of the 67.59-87.08 NZD rally
71.76 Support 78.6 Fib of the 67.59-87.08 NZD rally
67.59 Support 2004 Low
Weekly Chart

Daily Chart I

Daily Chart II

Daily Chart III

Sam Shenker is a Technical Currency Analyst for FXCM.