| The Wagner Daily ETF Report For July 3 |
| By Deron Wagner |
Published
07/3/2013
|
Stocks
|
Unrated
|
|
|
|
The Wagner Daily ETF Report For July 3
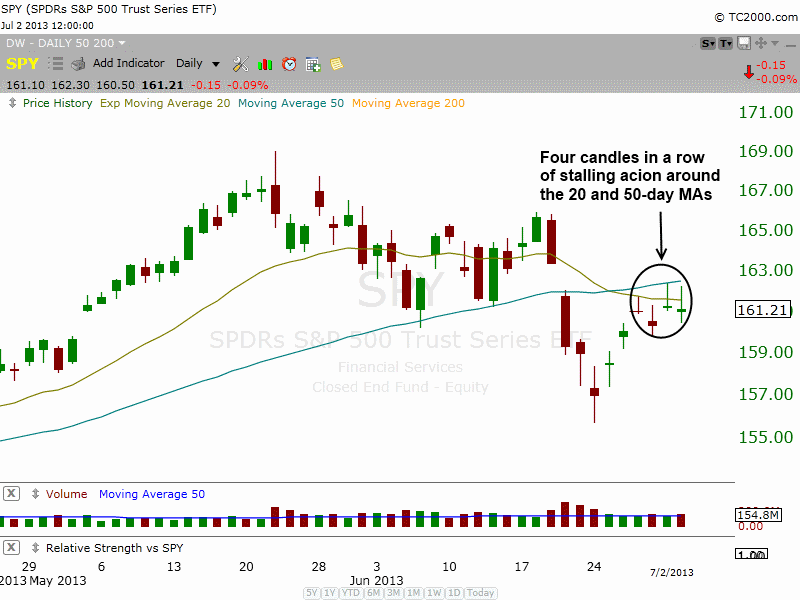
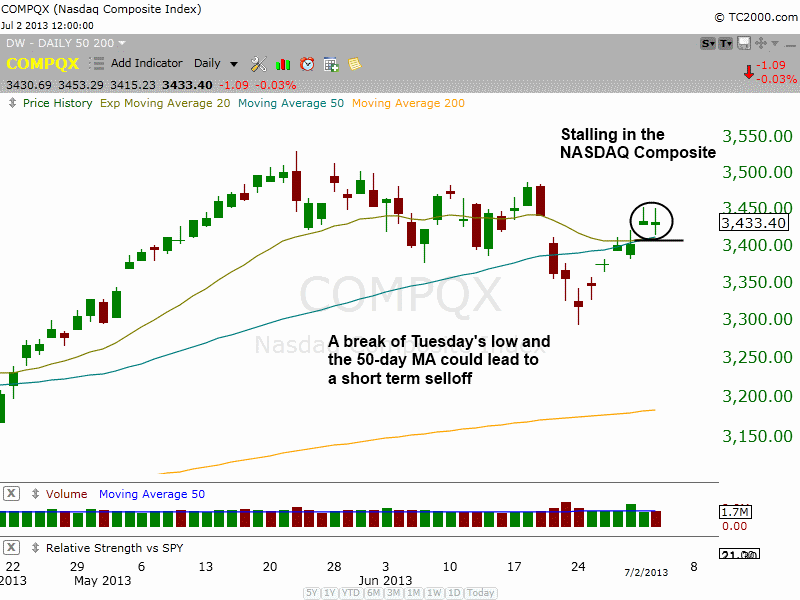
Stocks sold off into the close once again, with the S&P 500 stalling at resistance of the 50-day MA for the third time in four sessions. Total volume picked up, but losses were limited to to less than -0.1% on the S&P 500 and NASDAQ, so it was not a clear cut distribution day (but an ugly day nonetheless). After multiple days of stalling action in the major averages, we expect some sort of pullback to develop by next week. Because leadership stocks have held up, we believe that any pullback will be short-lived. However, if leading stocks begin to crack with the market, then we will begin to test the waters on the short side.
Multiple days of stalling action at resistance does not look good:


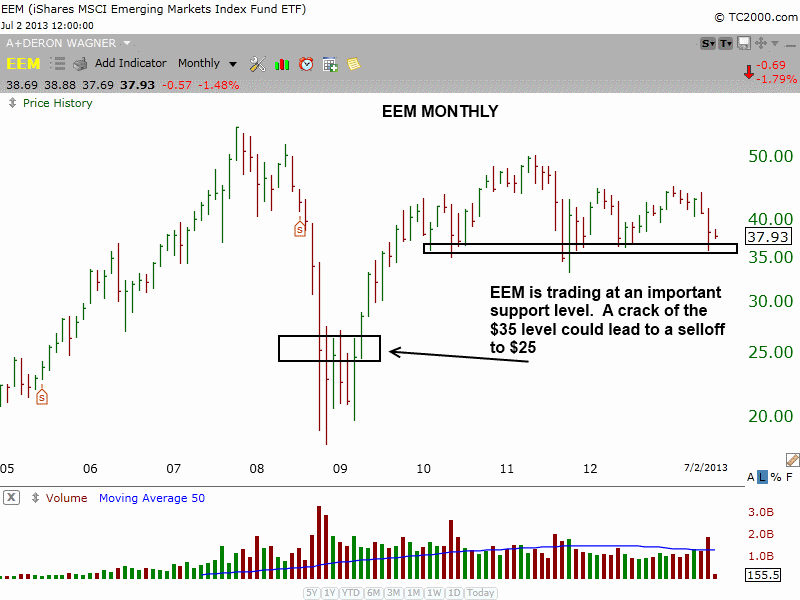
Money continues to rotate out of emerging markets, resulting in iShares MSCI Emerging Markets ETF ($EEM) selling off to an important support level at $35 on the monthly chart below.

A break of this level could lead to a test of the bottoming pattern in 2009, around $25. This pattern is not actionable right now, as $EEM is already a bit extended after a two month selloff. The setup could be in play down the road if $EEM trades in a tight range near $35 while market conditions weaken.
$USO remains a potential buy candidate for next week depending on how it closes out the current week, as we would like to see a strong close near the highs of the week (above $35).
Until market conditions settle down, our best position is being mostly in cash. A few setups may outperform for a week or two, but when volume patterns are bearish (as they are now) tight stops are not very reliable. Now some of you might be thinking, well if tight stops are not good right now, then why don't we go with loose stops. That is a valid question with a very simple answer. In a weak market, stops must be tight because we simply can't trust the market and 9 out of 10 stocks sell off with the market. In a bull market, stocks may sell off unexpectedly for a day or two, but bullish conditions should lift the stock higher within a few days.
Let's review the keys to our timing model:
-- Higher swing lows in major averages - Yes (so far)
-- Major averages above 10-week MA - No
-- Bullish volume pattern - No (still bearish)
-- Buy signal (follow through day) - No
-- Price and volume action of leading stocks - Acting well (only part of model in good shape).
Although the market timing model is in sell mode, we will from time to time take a shot (with reduced size) on the long side, provided that the market is not setting lower lows on the daily chart. The timing model was constructed to prevent us from making costly mistakes by trading against the trend. But as with most successful stock systems, discretion plays a big part, so taking a few positions in leading stocks at an important support level is fine and will not get a trader into a ton of trouble. However, taking 5-8 new longs with 40-60% exposure is a bit extreme, especially when there is no confirmation that a new rally is under way.
Deron Wagner is the Founder and Head Trader of both Morpheus Capital LP, a U.S. hedge fund, and MorpheusTrading.com, a trader education firm.
|