| The Wagner Daily ETF Report For July 5 |
| By Deron Wagner |
Published
07/5/2013
|
Stocks
|
Unrated
|
|
|
|
The Wagner Daily ETF Report For July 5
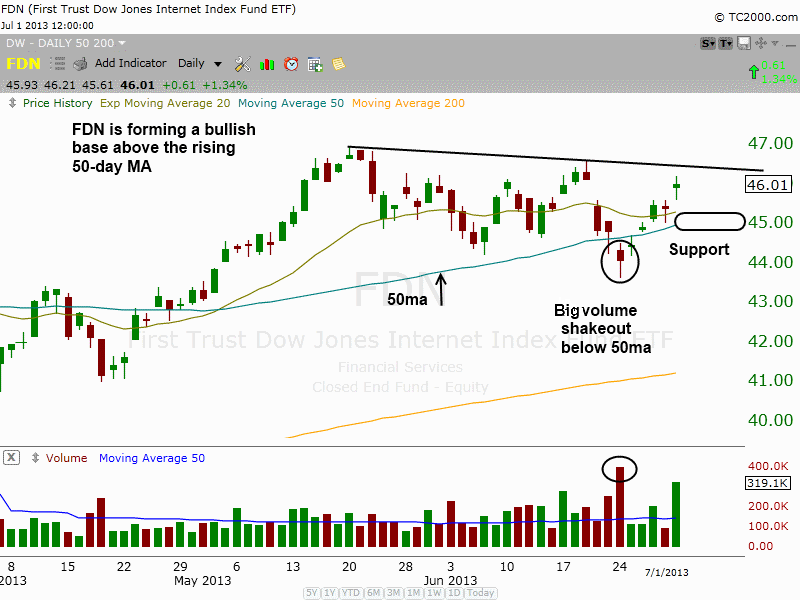
In the July 2 issue of The Wagner Daily, we pointed out the relative strength and bullish chart pattern of First Trust DJ Internet Index ($FDN). To refresh your mind, below are the annotated daily and weekly charts we showed you at that time:


Although a quick pullback to support of the rising 50-day moving average would have provided a low-risk buy entry, it now looks as though such a pullback may not occur before the breakout. This is because the price action has traded in a tight and narrow sideways range over the past three days.
Showing relative strength in the July 3 session by gaining 0.7% versus the 0.3% gain of the Nasdaq, $FDN could now trigger a valid buy entry on a rally above the 3-day high. As such, subscribing members of our swing trade newsletter should note our exact entry, stop, and target prices for this setup in the "Watchlist" section of today's report.
In our July 1 commentary, we said we were stalking US Oil Fund ($USO), a commodity ETF that tracks the price of crude oil, for potential breakout entry on its weekly chart. At the time, we said a buy entry was not yet actionable because the ETF was still trading roughly 2.5% below pivotal horizontal price resistance. However, over the past three days, $USO has surged higher and convincingly broken out on its weekly chart, as shown below:

Although it cannot be seen on the weekly chart above, $USO jumped 1.8% in the most recent session. More importantly, that price gain was accompanied by a volume spike that was the highest turnover of any day so far this year (about 200% the average daily volume of $USO). This is important because the increasing volume confirms the presence of institutional buying, which therefore decreases the likelihood of a failed breakout.
Because this breakout is from such a lengthy base of consolidation, with no recent overhead resistance levels, our price target in $USO is quite substantial (test of May 2011 highs, which is roughly 27% above the current price). Obviously, this means we also intend to maintain a longer than usual holding period for $USO than with our typical swing trade (estimate of 1 to 2 months).
Deron Wagner is the Founder and Head Trader of both Morpheus Capital LP, a U.S. hedge fund, and MorpheusTrading.com, a trader education firm.
|