Stocks surged higher across the board, with all major averages gaining at least 1.0% on the session. The NASDAQ Composite rallied 1.6% on an 11% increase in volume, which produced a bullish "follow-through day." A follow-through day occurs whenever the S&P 500 or NASDAQ rallies around 1.5% on higher volume. We would also label yesterday's price and volume action in the S&P 500 as a follow-through day, as the index rallied 1.4% on a 15% jump in volume.
Thursday's follow-through in the NASDAQ and S&P has generated a mechanical "buy" signal in our stock market timing model. This signal allows us to be fully invested on the long side, provided that there are bullish patterns to buy. In our model trading portfolio, we are already 50% invested on the long side, and expect to add more exposure over the next few weeks as new setups develop.
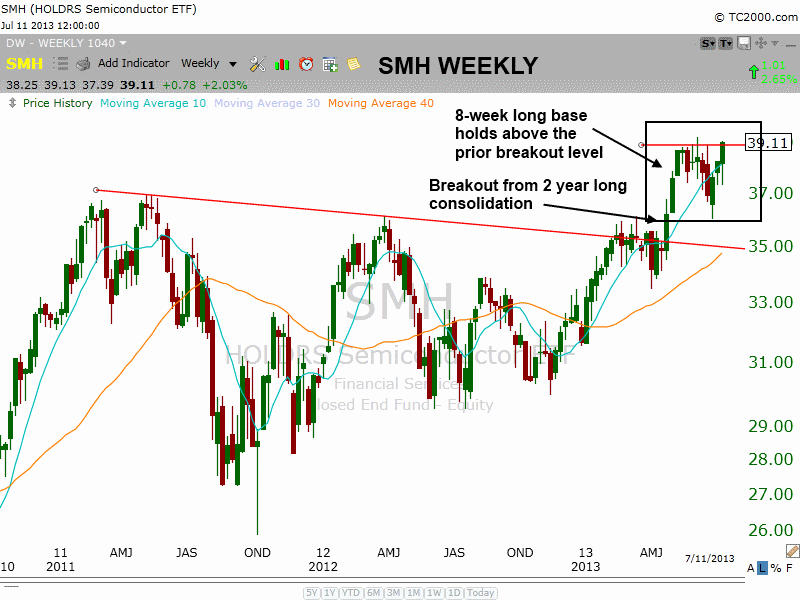
Merrill Lynch Semiconductors HOLDRS ($SMH) hit a new closing high for the year on the daily chart yesterday, and if it can close above 39.28 today, then it will also have broken out from an 8-week consolidation at the highs. The current 8-week base has held above the highs of the last base, which was two years long.
Usually when a stock or ETF breaks out from a long base, the first correction after a big breakout is shorter in time and much more shallow (which is exactly what $SMH has done on the chart below):

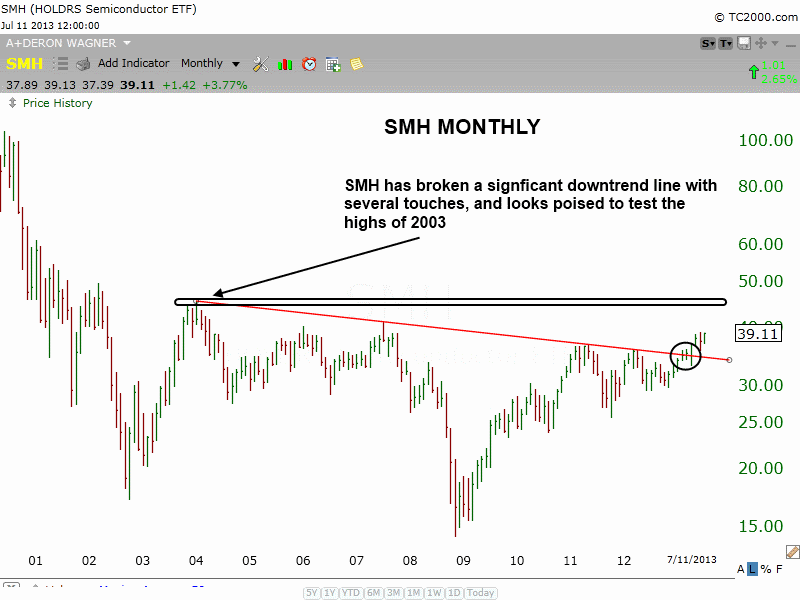
On the monthly chart, $SMH has recently broken a significant downtrend line, and if momentum continues to build, then it should eventually reach the highs of 2003, around $45-46. We are monitoring the action for a confirmed breakout, and will let you know if/when we decide to officially enter the trade.

Deron Wagner is the Founder and Head Trader of both Morpheus Capital LP, a U.S. hedge fund, and MorpheusTrading.com, a trader education firm.