As unlikely as it seemed with the VIX and VXN finally coming up off of unheard-of low levels, the market managed to silence the bears who were clearly in charge last Friday. A bit of a surprise? Yeah, considering the volume we saw that day. It had to be institutional selling, which is usually not just a one-day event. But this time, it was a one-day wonder. We saw nothing but buying this week, but it wasn't the kind of snap-back buying that can follow a big tumble.....the panic buying. It was that slow, methodical buying that says people are actually thinking before they make their purchase. The end result was a full reversal of what looked like what could have been a really rough period for stocks. In fact, we got some significant buy signals by the end of the day Friday.
One of the toughest things to do is act on what the market is doing, rather than what it 'should be' doing. But, that's the discipline required to stay in the game. Any undue loyalty to an opinion or trend will only lead you down the wrong path. We say that now to make it clear that our bearish slant over the past few weeks may have fully played out, as we see bullish pressure building. On the flipside, we still say it's too soon to get overly bullish. The next couple of days are critical, as the upside reversal depends on how we do early in the coming week. In any case, let's look at where we are now, and where charts might be headed next.
NASDAQ Commentary
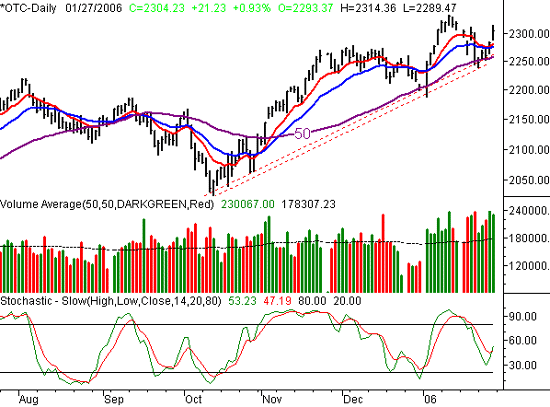
The key item we want to focus in on the week is the NASDAQ's cross back above all the important moving average lines. We fell under the 10 and 20 day lines last Friday (pretty decisively), tripping a technical short-term sell signal. But once again, the move under the 50 day line (purple) was short-lived.....much like the brief period we traded under the 50 day average on the first trading day of the year. That rebound was strong, as this one could be. That bounce also defined a support line that extends all the way back October's lows.
But the impressive part is the volume behind the move. It really wasn't evident until Friday, but last week's bullish volume was growing day by day, In fact, last week's bullish volume rivals the huge wave of buying we saw in the first week of this year. So, the bulls have made it clear that they're not going to let a strong selloff scare them.
In the meantime, the stochastic lines are both back on the rise, never having reached the 'oversold' area.
So is this a complete buy signal? Close, but not quite yet. The official bullish green light will come with the next higher close. That could be as early as Monday, but may also take a couple of days to materialize. Ideally, it would happen after the 10 day line was verified as support....just to force the bulls to verify that last week wasn't a fluke. Quite frankly, it's difficult to make such a leap, knowing how quickly the market can stop and reverse, and knowing how the NASDAQ has handed us several huge dips just after getting a good upward start. But as we said above, the chart is the chart. We'll take it at face value. Be smart here, but don't be afraid that this rally can't continue. All we need is a small boost early next week.
Last week, the NASDAQ gained 2.52% to close at 2304.23. That was a 56.53 point gain.
NASDAQ Composite Chart - Daily

S&P 500 Commentary
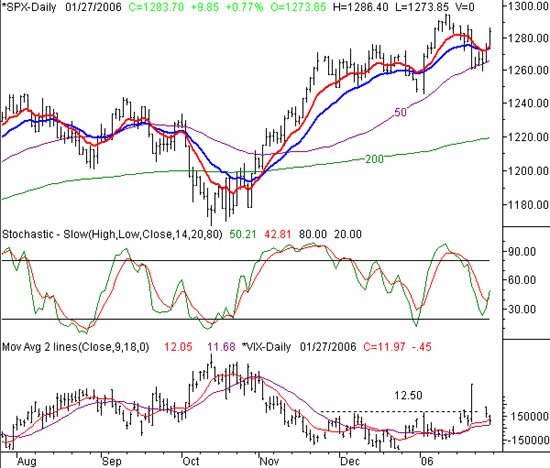
The S&P 500 had a pretty bullish showing last week too. The large-cap index closed at 1283.70, up 22.20 points from the prior week for a 1.76% gain. And in the case of the SPX, the 50 day moving average (at 1265.50) laid the groundwork for the recovery. The VIX, however, is still at troubling levels, having not followed through on the previous Friday's breakout move.
The key thing to note, however, is the cross back above the 10 day average, at . The S&P 500 found support there on Friday. That's the first part of a two-part buy signal. The second part will be a close above that close at 1283.70. Maybe it will happen in Monday, or maybe later in the week. As long as we don't close under the 10 day line, the uptrend is not in question. And unless we actually close under the 50 day line, we won't be entertaining the idea of a bearish move. In the meantime, let's see how the beginning of the coming week unfolds.
We'll just add this....the momentum as of Friday was bullish, but don't look for this move to jump-start anything that carries the market straight up for months. All the moves have been minor - even the October rally. Realistically (based on recent history), the SPX would start to run into headwinds in the mid-1300 area. That still leaves room for a trade-worthy rally, but we doubt that the general lack of traction will persist froa while.
When will the mareket really start to move? A few weeks ago we pointed out that the low VIX readings were accurately forecasting an involatile market. So far, that's been right. It appeared that the drought could be over with last Friday's big surge, but now the VIX is back to its 10 day average. In other words, not a lot has changed on that front.
By the way, that low VIX is one of the biggest liabilities we see right now. Big rallies just don't start with this much complacency. We have to wonder if the only reason the VIX is back to the mid-11 area is because of the monster spike we went through two Friday's ago. In any case, this low VIX is why we think any rally will be on the smaller side. In the meantime, be aware of any strong moves higher for the VIX....it may be an omen of a correction, even if the rally never gets started.
S&P 500 Chart - Daily

Dow Jones Industrials Commentary
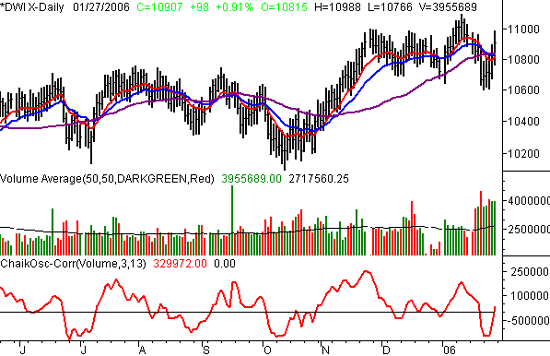
The Dow's 2.25% gain last week didn't beat the NASDAQ's, but it was certainly a good race. This blue-chip index added 240 points to close at 10,907, which is - needless to say - knocking on the door of that bog 11,000 mark again.
The interesting part here is the volume behind the move...it's been big. In fact, the buying volume here has been about as good as we've seen it months. There are actually two ways to interpret that. The first way is to view it as bearish, where investors are fleeing to the safer blue-chip companies. The second way is straight-forward bullish, where more and more people are buying stocks. Given that the NASDAQ as well as the S&P 500 both made even bigger gains on a similar volume increase, we're going to side with the bulls for the time being. The Chaikin line cross back above zero is an official buy signal.
In the meantime, be cautious around 11,000 and the recent high of 11,099. That may be just the excuse needed to start the selling again. And with the VIX at alarmingly low levels, we know that potential is there.
Dow Jones Industrials Chart - Daily

Price Headley is the founder and chief analyst of BigTrends.com.