And now we return to our regular scheduled programming.
We've demonstrated that decent results can be churned in virgin data via optimization in prior five year data blocks. Caution still has to be observed. If you just act off the best of a number series for no other reason than it happens to be the best, you're more than likely on the road to ruin. By contrast, what we've done in our postings up through the optimization series is:
1. We've identified individual biases in the markets.
2. We've ensured some degree of robustness by making the same idea positively perform in an array of different markets and time frames.
3. We combined the building blocks, careful not to muddy the waters with additional features we hadn't tested prior.
4. In acknowledgment of market "drift," we've allowed ourselves to change parameters within these principles without radically altering the principles themselves. We believe there's a bias to a close being above an x-day closing average. We haven't allowed ourselves to toss the concept out over some numbers while embracing others. We accept the concept in total, and we also allow that the numbers that will work best over time will change.
5.The proof is in our pudding. The latest positive numbers we've produced are all parts of time blocks that were outside of the optimization process. The years 1996 through 2000 produced 2001 results. 1997 through 2001 produced 2002, and so on. In other words, we forward tested in future "virgin" data, which is 100 percent of what we posted in the last two optimization entries as well as this one.
It would reasonable at this time to make the following observation: "Ok, great. We can churn out positive 'virgin' numbers by making them conform to our 'drivers' (understanding of market dynamics), keeping our tests pure and uncontaminated by extraneous components. But how do these results compare with, say, how we would have done had we kept our original optimized numbers from our original starting point (2000)?”
Good question. The answer, in part, follows.


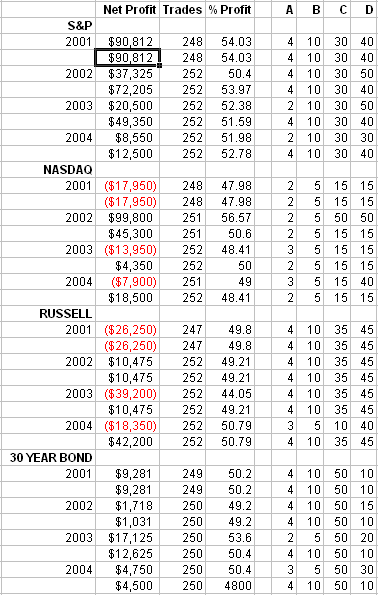
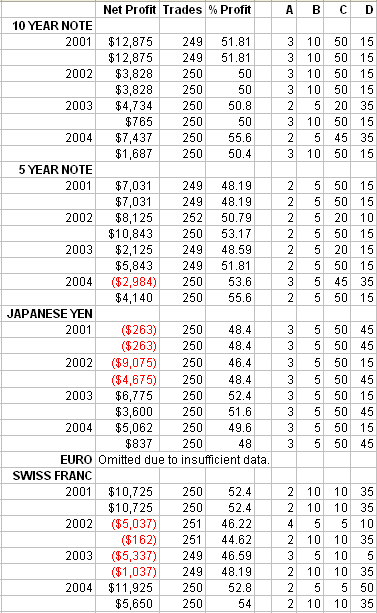
The first number in each column is the same yearly optimized number we displayed in Optimizing Your Mechanical Trading, Part 5. The second shows the original 2000 optimized numbers used for all the following years. That is, the data was not re-optimized at the beginning of every year using the previous five years of data. We'll discuss the implications of the results tomorrow.
P.S. I'd love to receive feedback from you. Please leave a comment or discuss the article by clicking on "Make a comment on this article" below.
Art Collins is the author of Market Beaters, a collection of interviews with renowned mechanical traders. He is currently working on a second volume. E-mail Art at artcollins@ameritech.net.