| The Wagner Daily ETF Report For August 13 |
| By Deron Wagner |
Published
08/13/2013
|
Stocks
|
Unrated
|
|
|
|
The Wagner Daily ETF Report For August 13
Our style of trading relies heavily on identifying the intermediate-term trend. In order to trade with the trend (when the market is in an uptrend), we have an automatic trend qualifier in place for all our daily scans, where we demand the price action be above certain moving averages.
For example, unless the market is coming out of a major decline, all stocks and ETFs we scan for will be trading above the 50-day MA, with the 50-day MA above the 200-day MA.
The 50-day MA must be trending higher for a few months and the 200-day MA must, at the very least, be starting to turn up. By doing this, we force ourselves to screen only for names that are in trend mode along with the market, and enabling us to avoid the temptation of bottom fishing.
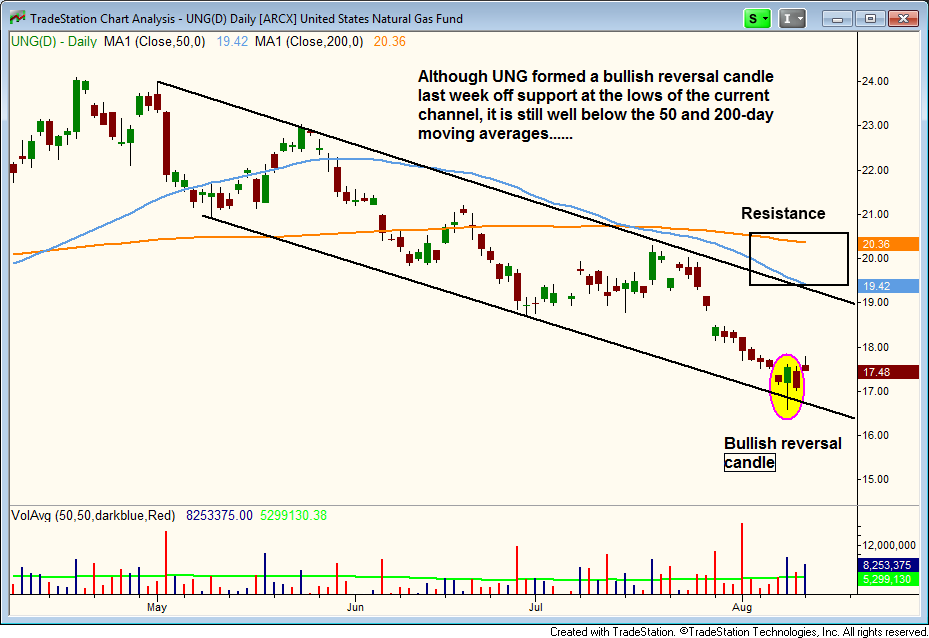
The current chart of United States Natural Gas ($UNG) is a solid example of a stock/ETF that does NOT meet our trend criteria. As you can see on the chart below, $UNG is clearly in a downtrend with a series of lower lows and lower highs on the daily chart, as it trades in a downward trending channel (between the black trendlines).
The 50-day MA (in blue) is below the 200-day MA (in orange), and the 50-day MA is in a downtrend the past few months. The 200-day MA has flattened out and is beginning to trend lower as well. This chart is exactly what we are NOT looking for to enter a trade.
Although $UNG has found support at the lower trendline of the channel, it still has a ton of work to do to get through the $19 to $20 area, so we are not interested in this chart until that happens. There are many different investing styles to chose from, but focusing on the intermediate-term trend is what we are comfortable doing:

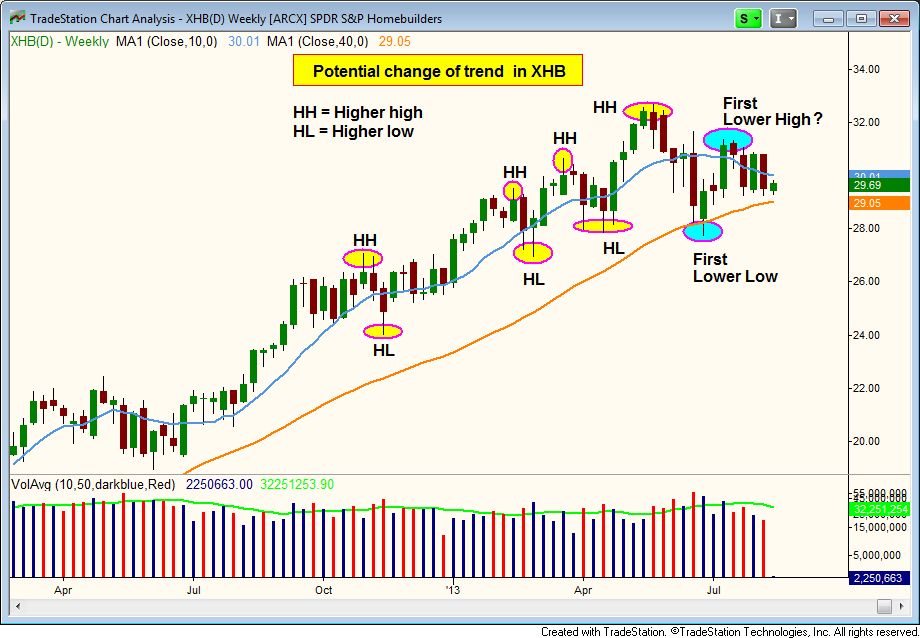
The chart of $UNG above was a clear example of a downtrend with lower highs and lower lows. However, on the weekly chart of SPDR S&P Homebuilders ($XHB) below, we see the exact opposite, with the price action setting several higher highs and higher lows over the past 12 months. Still, the price action has lost momentum over the past few months, and the uptrend is in danger of reversing:

$XHB was in a clear uptrend until June, when the swing low in late June undercut the prior swing low from April. During the bounce back to $31 in July, $XHB stopped well short of the prior high, putting in the first lower high in quite some time.
Now, $XHB may only be in consolidation mode, and as long as it holds above the recent low in June, that could very well be the case. But if that low is broken, then we will have the first indication that a potential reversal of trend is underway.
Deron Wagner is the Founder and Head Trader of both Morpheus Capital LP, a U.S. hedge fund, and MorpheusTrading.com, a trader education firm.
|