NASDAQ Commentary
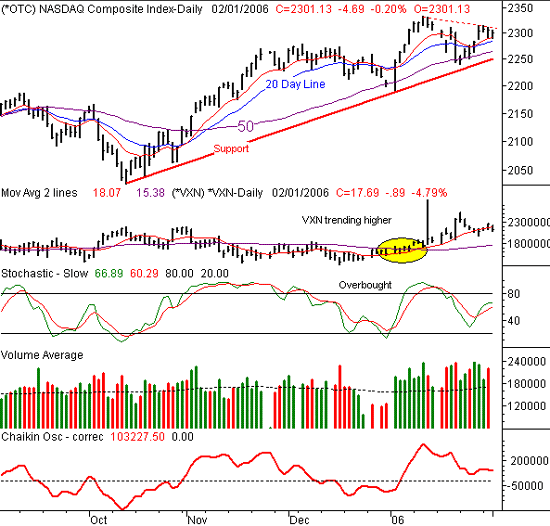
The NASDAQ Composite continues to flounder, dipping into the red today (and yesterday) after putting up some decent numbers last week. Of course, that bullish week followed one of the worst weeks we've seen in months (which ironically followed one of the best weeks we've seen in ages). The point is, the market is spinning its wheels, but not getting anywhere. We thought, after last week's steady recovery, that we finally might get a decent bullish move. But so far, no dice.
For the day, the NASDAQ is down 4.7 points (-0.2%), while its underwater by 3.1 points (-0.13%) for the week. Tepid would be a good way to describe it, although it's not unusual at this point.
It's also a tale of two trends, where the bulls and the bears both have good arguments.
As for the bulls, they'd say that yesterday's and today's support at the 10 day moving average tells us the buyers have drawn their line in the sand. We're actually inclined to agree with that. But a close inspection reveals that's all the bulls really have going for them at this point.
The bears would argue that despite the support at the 10 day average, there's a stark lack of upside follow-through. We're inclined to agree with that too. However, the bears could also point out the fact that Friday's peak of 2314.36 hasn't even been matched all week long. And if it's not challenged anytime soon, then technically speaking, what we have here is a lower high (see dashed line). But wait - the bears have some more ammo. They could also point out that all those high volume bullish days we've seen over the last couple of weeks really haven't done anything to send the Chaikin line upward. In fact, the Chaikin line is still generally pointed lower, confirming that the volume trend is still a bearish one, even though it may really seem otherwise.
Oh wait, there's more.......the CBOE NASDAQ Volatility Index (VXN) is still ridiculously low. At the risk of sounding like a broken record, short-term rallies just don't start with the VXN making a bottom. If it happens this time, it would be a major statistical outlier. (be sure to read more VXN thoughts below)
Yet there are two undeniable facts.....the 10 day line is still acting as support, and the VXN is actually pointed lower again. This multi-sided scenario leaves us stock somewhere in between the bullish/bearish tug-of-war. And so far, we still have no reason to think that this index will move any higher than it has this leg. It may be worth waiting to see if we can at least break above 2315. If we can do that, it would be much easier to get fully bullish. And as far as the VXN is concerned, here's another reality......although it's dangerously low, it's still not as low as it was just a month ago. Its current reading of 17.7 is still five points above December's low. So, there is a little room for a small move higher, if the market can get anything started.
NASDAQ Chart

S&P 500 Commentary
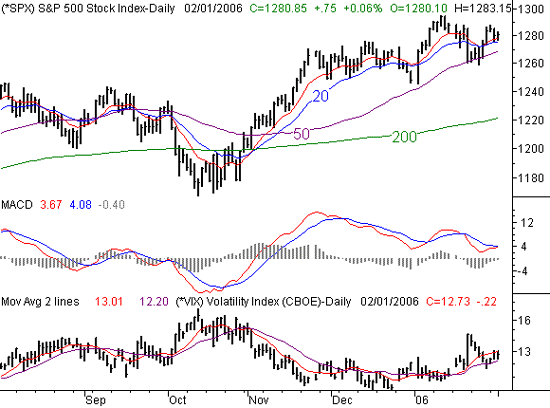
There's really not much to add for the S&P 500. There's support at the 10 and 20 day lines, but that's about it as far as bullishness goes right now. After getting back above those lines last week, the buying seems to have faded, which leaves us (so far) with a lower high. For the day, the SPX is up just a hair, and for the week, it's down 2.85 points (-0.22%).
We thought we might see a bullish MACD crossover here....and we still might. But so far, we're unimpressed with the buying effort. The thing is, even of we do get a bullish MACD cross, it may not mean a lot; we got one in early January too, right before the index gave up almost all of that big gain.
And, as you might guess, the CBOE S&P 500 Volatility Index (VIX) is still a conundrum. The big break above resistance last Friday left the VIX at 14.56, which was bearish for stocks. The VIX hasn't been anywhere near there since then. However, over the last three days, the VX has found support at the 50 day line, and has been creeping higher. For the same reason as before, a low VIX will likely coincide with stocks heading lower, especially mow that it's on the rise again. That's the major liability right now.
As for what to do, only a break above recent highs would put us in the bullish camp. Were it based just on last week's recovery alone we might not say that. But there's a clear lack of buying interest not, even after the Fed action was confirmed. As for bearishness, the 50 day line is still the key support level. It's currently at 1270, which leaves some room for a dip before we even start to get bearish. Be patient here.
S&P 500 Chart

Dow Jones Industrials Commentary
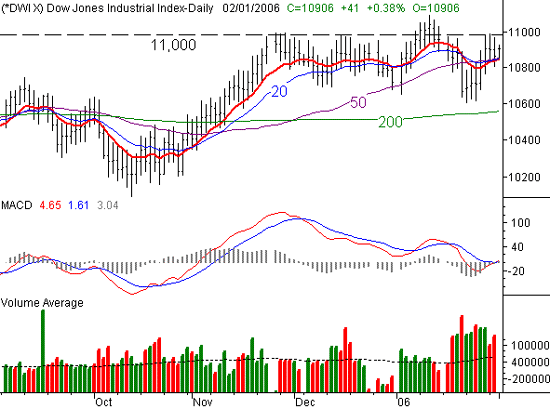
The irony is that the Dow is today's top performer, although that shouldn't be a surprise anymore. We've seen this for months, where whatever the NASDAQ was doing, the Dow was doing the opposite. So far, this blue-chip index is up 41 points (+0.38%) for the day, and flat for the week.
One of the unique factors here, though, is how close all the key moving averages are. In fact, the 10, 20, and 50 day lines are all within 5 points of one another, which makes for a pretty tough support or resistance area. And even the 200 day line is only about 300 points under all the other lines.
The good news is that this situation may mean the Dow will be the first to give a clue as to the next major move. The index is resting on thee support at the 10/20/50 day line combo, yet is still struggling with resistance at 11,000. One of those will have to give soon, so sit tight.
Dow Jones Industrials Chart

Price Headley is the founder and chief analyst of BigTrends.com.