| The Wagner Daily ETF Report For August 20 |
| By Deron Wagner |
Published
08/20/2013
|
Stocks
|
Unrated
|
|
|
|
The Wagner Daily ETF Report For August 20
Market conditions continue to weaken, as stocks closed in negative territory for the fourth session in a row. With the exception of the NASDAQ Composite, all major averages are trading below the 50-day MA, which is our line in the sand for a bull market. With the NYSE and NASDAQ volume patterns turning bearish and most indices below the 50-day MA, top-tier leadership stocks is the only part of the timing model that is holding up. If true leaders such as $LNKD, $KORS, and $TSLA begin breaking down, along with other institutional favorites such as $GILD, $CELG, $GOOG, $AMZN, and $PCLN, then our timing model will be forced into "sell" mode and we'll begin to establish new short positions.
In yesterday's ETF analysis, we mentioned the recent money flow into commodity ETFs such as Oil and Precious Metals. Specifically, we highlighted the relative strength in iShares Silver Trust ($SLV) over SPDR Gold Trust ($GLD), due to the strong separation from the 10-week MA and heavier volume in $SLV.
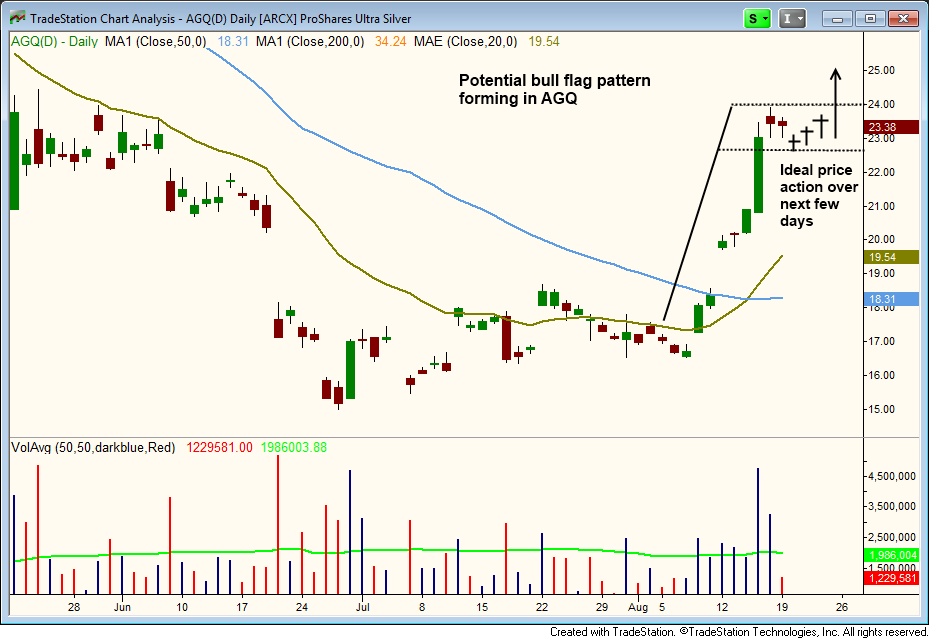
With $SLV stalling out the past two sessions, we could potentially see a bull flag type pattern emerge by the end of the week on the daily chart. Rather than buying $SLV, we are going with the 2x leveraged, ProShares Ultra Silver ETF ($AGQ). The daily chart below details the potential setup with our ideal price action over the next few days:

The move off the recent swing low in $AGQ was about six days in length, forming the mast portion of the "bull flag" pattern. The past two days of stalling action begins the flag, which has yet to flesh itself out and will need a few more days of sideways chop to do so.
From what we have seen over the years, the best bull flag patterns tend to have a flag that is equal to or less than the number of days in the mast. For example, if the run up (mast) was seven days in length, the flag should be anywhere from three to seven days in length. If the flag portion takes longer than seven to eight days to go, it could be that the stock/ETF is not ready to go and will need more time to consolidate.
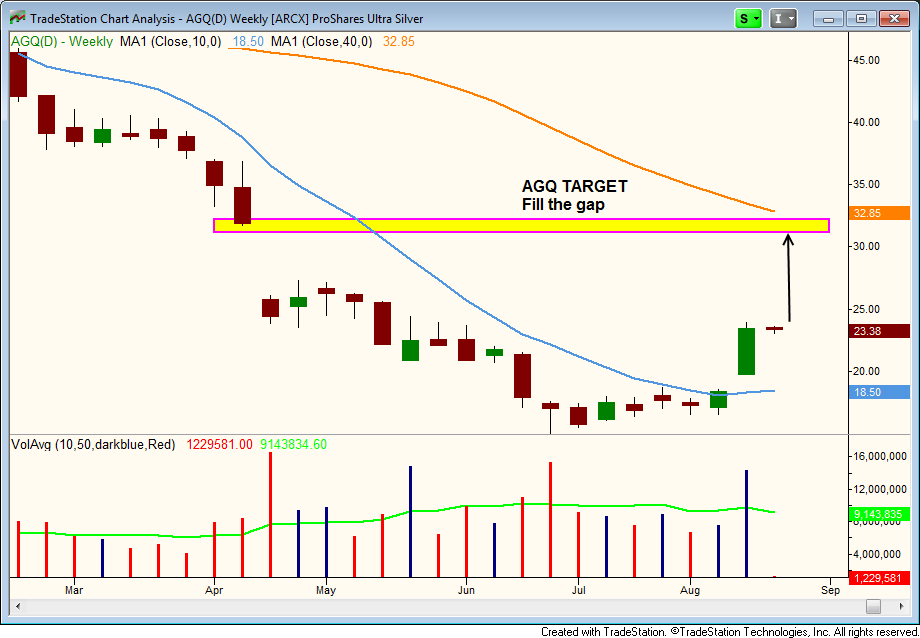
If $AGQ does trigger for buy entry, our upside price target is a fill of the large gap down created on April 15 (just below $32):

The specific trigger price for buy entry, as well as the stop price, is available to regular subscribers of our swing trading newsletter in the "watchlist" section of today's report.
Please note that this is a counter-trend, momentum swing trade, which we sometimes take in commodity-based setups because they have the potential to trend really well after a strong reversal. Because of this, we are reducing our share size to only 35% of a full position. Since this is anticipated to be a fairly quick momentum trade (1-3 weeks), we do not mind using $AGQ over $SLV. However, when momentum fades, the leveraged ETF products tend to underperform their underlying (so do not buy and hold $AGQ over $SLV).
Deron Wagner is the Founder and Head Trader of both Morpheus Capital LP, a U.S. hedge fund, and MorpheusTrading.com, a trader education firm.
|