| The Wagner Daily ETF Report For August 23 |
| By Deron Wagner |
Published
08/23/2013
|
Stocks
|
Unrated
|
|
|
|
The Wagner Daily ETF Report For August 23
Until last week, our market timing model was in "buy" mode for many months. As such, we have only been focused on swing trading stocks and ETFs on the long side of the market.
However, now that our timing system has shifted to "neutral" mode, our trading rules allow us to selectively initiate new short positions in stocks and ETFs with relative weakness to the broad market.
One such ETF that is setting up for possible short sale entry is iShares U.S. Real Estate ETF ($IYR), which looks to be in trouble after an ugly breakdown below the 40-week moving average (same as 200-day moving average) at the beginning of this month.
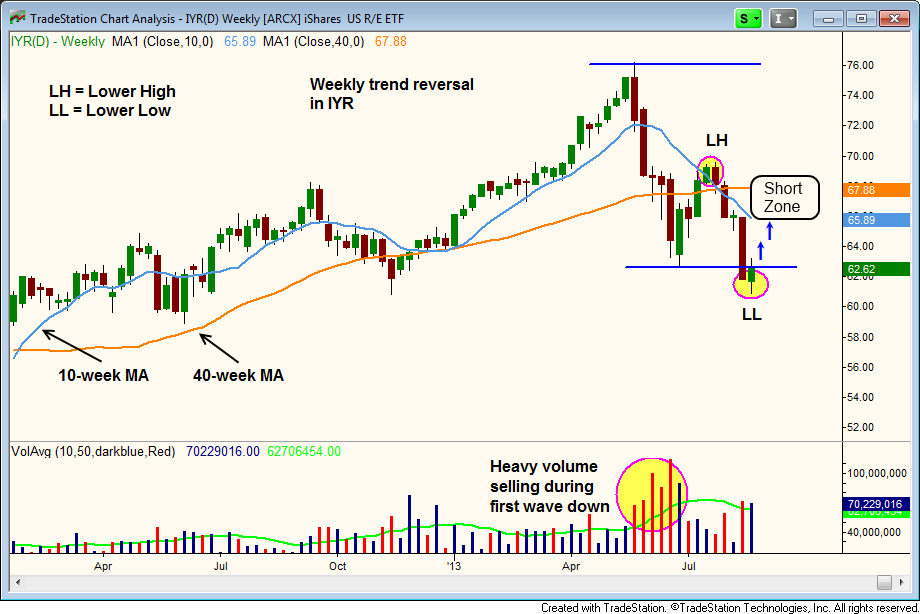
The weekly chart below is starting to look pretty bearish, as the multi-year uptrend appears to be reversing to the downside:

Looking at the chart above, notice that $IYR sold off on heavy volume from May 19 to June 23 (volume bars circled in pink), as it broke down below support of its 10 and 40-week moving averages.
After a light volume bounce back above the 40-week moving average a few weeks later, the price action stalled at the 10-week MA and sold off again. On the next move down, $IYR broke below support of its prior swing low from June 2013.
By breaking the last swing low, $IYR has now set a lower high ("LH") and lower low ("LL") on the weekly chart, which signals a potential reversal of the dominant uptrend.
Along with the price action breaking down below key moving averages, notice the 10-week MA recently crossed below the 40-week MA. This is a bearish trend reversal signal that indicates an intermediate-term top may be in place.
As for our intended short selling entry point, it is important to know we typically do not like to sell short a stock or ETF as it is breaking down below support of a swing low (unless tight consolidation has previously formed near the prior low). Instead, we prefer to wait for a subsequent bounce into resistance that follows the breakdown below support (click here for a more detailed explanation of our short selling entry strategy).
Because $IYR has just suffered a big breakdown on the weekly chart, the price is oversold in the short-term and the ETF is due for a bounce. As such, $IYR is not a low-risk short entry at its current price.
Rather, a bounce into new resistance of the 10-week over the next few weeks (around the $65.00 area) would present an ideal, low-risk entry point to sell short. As always, paid subscribers of our ETF and stock pick newsletter will be alerted to our exact entry, stop, and target prices for the $IYR short sale if/when we enter this bearish ETF swing trade.
Deron Wagner is the Founder and Head Trader of both Morpheus Capital LP, a U.S. hedge fund, and MorpheusTrading.com, a trader education firm.
|