| The Wagner Daily ETF Report For August 29 |
| By Deron Wagner |
Published
08/29/2013
|
Stocks
|
Unrated
|
|
|
|
The Wagner Daily ETF Report For August 29
Stocks established some momentum early, posting gains of 0.5% or so by 1 pm. However, the morning rally lacked any afternoon punch, as stocks slid lower late in the session, giving back about half of the day's gains. The NASDAQ, Dow Jones, and S&P 500 stalled just shy of the 20-period EMA on the hourly chart, which is usually the first significant hurdle for a chart to clear when there is a breakdown in the daily time frame.
Since breaking down below the 40-week MA on the weekly chart below for the second time in late July, the iShares Dow Jones US Home Construction ETF ($ITB) has seen very little breathing room, and every short-term bounce from here on out should find resistance from a declining 10-week MA or downtrend line:

With two lower highs and lower lows in place on the daily chart, the bearish reversal of trend in $ITB is already underway.
A bounce into the $22 to $22.50 area would be an ideal place to initiate a new, low-risk short selling entry, especially if the market puts in a weak bounce off the lows. Additionally, remember that iShares Real Estate ETF ($IYR) also remains on our internal watchlist as a potential ETF short selling candidate.
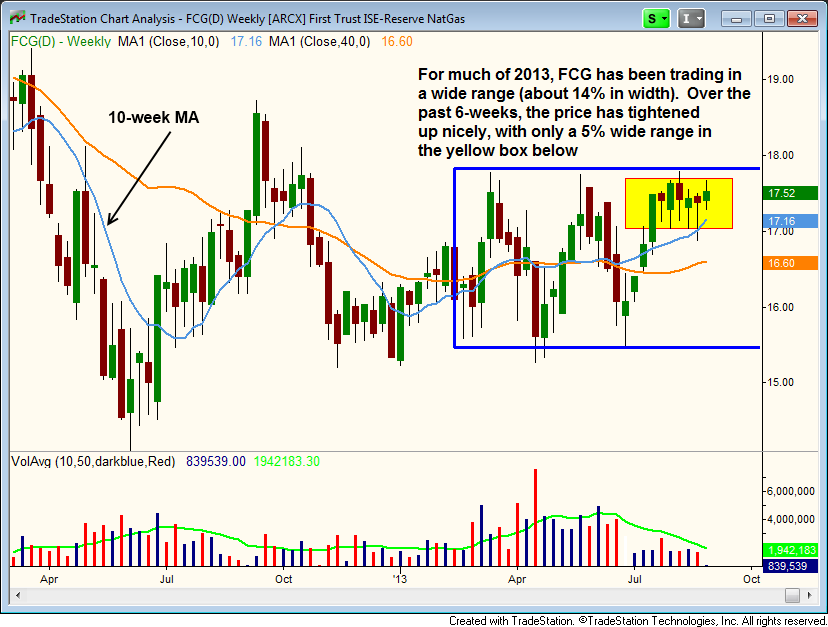
Our existing position in First Trust ISE Revere Natural Gas ($FCG) continues to trade in a tight range on the weekly chart, holding above support of the 10-week moving average. The weekly chart really shows how the price action has tightened up since mid-July.
From March to June, the average 6-week price swing from high to low was around 14%, but over the past 6-weeks the high to low of the range is slightly less than 5%, so the action has tightened up considerably. Whenever the price action coils up up near the highs of the range (within a long consolidation) it is usually a bullish sign, indicating that a potential breakout is near:

Officially launched just a few days ago, we are already receiving very positive feedback from traders who are taking a one-month test drive (just $4.95) of our new online stock screener for swing traders. If you have not yet taken this time-saving and powerful online software for a trial run, the upcoming holiday weekend may be a good time to fire it up. Click here now to start your trial membership.
Deron Wagner is the Founder and Head Trader of both Morpheus Capital LP, a U.S. hedge fund, and MorpheusTrading.com, a trader education firm.
|