After an ugly selloff in Market Vectors Gold Miners (GDX), which persisted for nine months, the ETF is now setting up for a potential bullish reversal of trend.
After an ugly selloff in Market Vectors Gold Miners ($GDX), which persisted for nine months, the ETF is now setting up for a potential bullish reversal of trend.
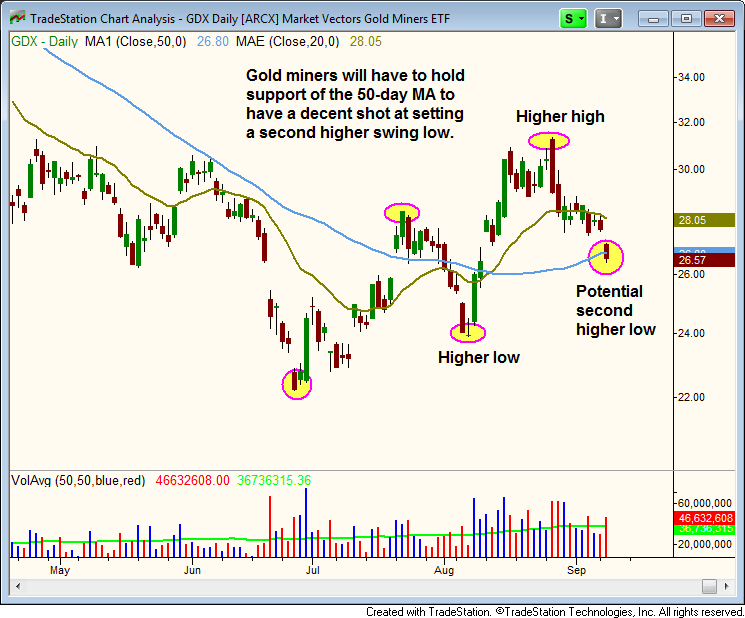
On the chart below, notice that both a higher low and higher high formed in July and August.
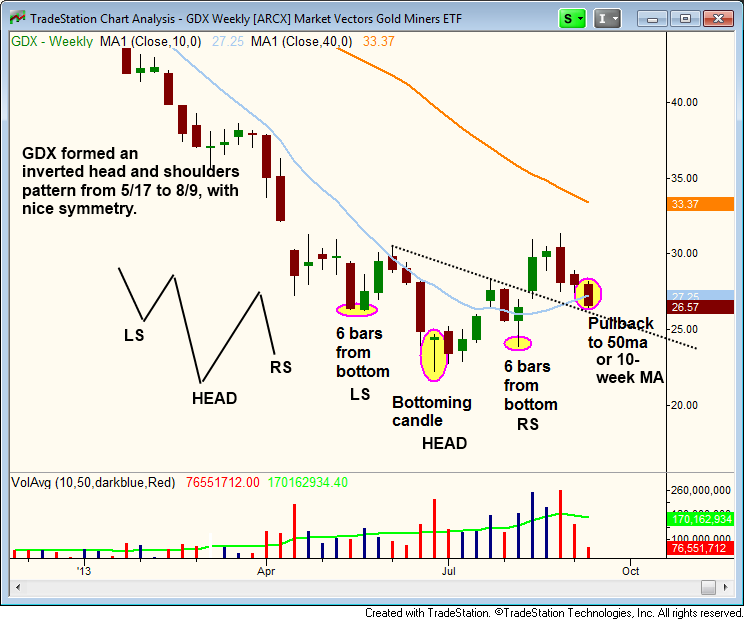
Of greater importance is the head and shoulders bottom pattern that formed from May 17 through August 9. This bullish chart pattern is the inverse of the bearish head and shoulders chart pattern.
Like many the bull flag and other stock chart patterns, the best formation of a head and shoulders bottom should have symmetry.
In this case, notice the symmetry between the left and right shoulders of the head (six candlesticks on either side): 
In order to have a decent shot of setting another "higher low," $GDX should now hold up around support of its 50-day moving average.
A second higher swing low, followed by another swing high, would confirm that a significant trend reversal is underway: 
Deron Wagner is the Founder and Head Trader of both Morpheus Capital LP, a U.S. hedge fund, and MorpheusTrading.com, a trader education firm.