| The Wagner Daily ETF Report For September 17 |
| By Deron Wagner |
Published
09/17/2013
|
Stocks
|
Unrated
|
|
|
|
The Wagner Daily ETF Report For September 17
Over the past few days, we have noticed a decline in the number of quality buy setups in our nightly stock scans, but this is to be expected when the broad market is extended in the short-term.
A few days of broad-based selling action to scare off some of the "late to the party Charlies" would be ideal, as it would absorb overhead supply that translates to technical price resistance. In turn, this could possibly present us with new, low-risk pullback buy entries.
Relative strength is an important tool we use every day when scanning for stocks and ETFs.
Pattern relative strength, in which we compare significant swing highs and lows of a stock or ETF against a broad market index like the S&P 500, is an easy way of identifying which stocks are strong and which are not.
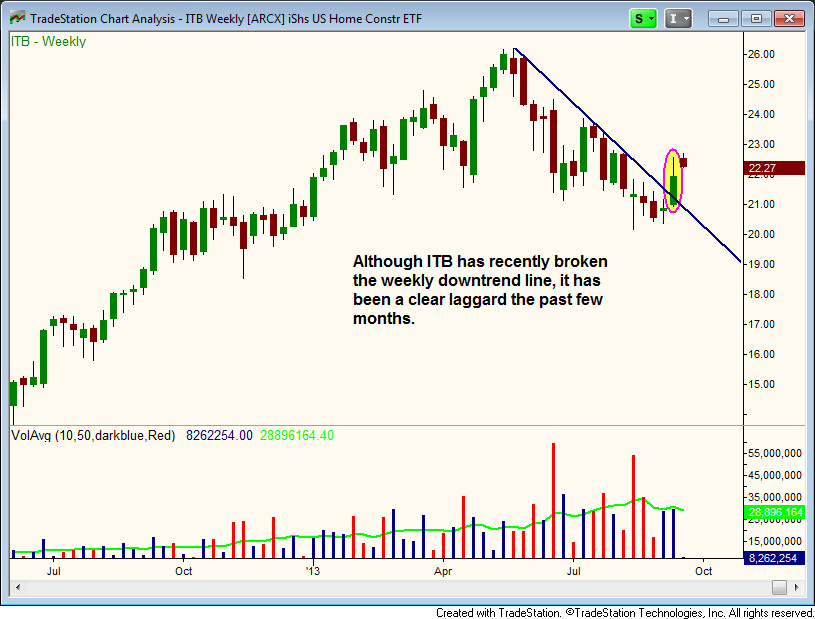
A good example of this is the recent price action in iShares U.S. Home Construction ETF ($ITB), which just broke above its dominant downtrend line on the weekly chart below:

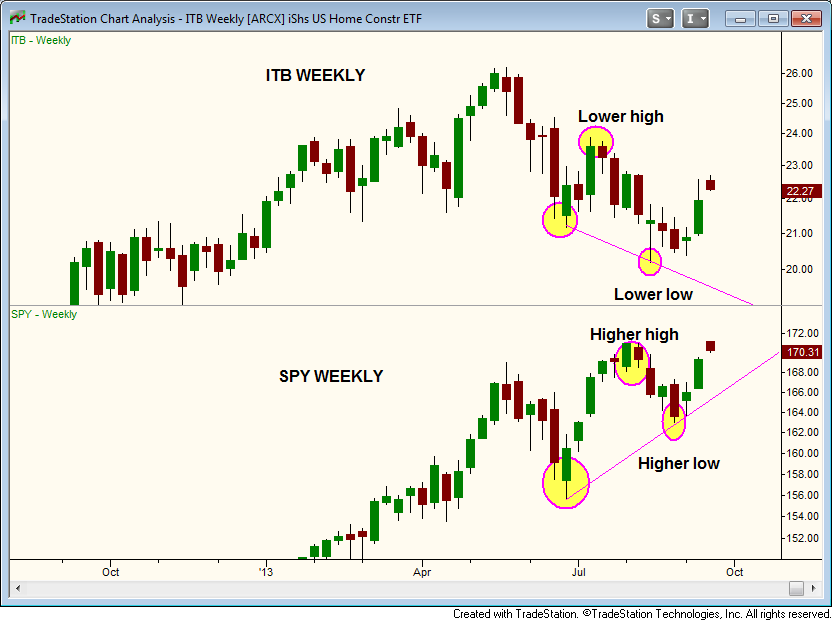
At first glance of the chart above, the breakout above the downtrend line looks bullish. However, when compared with the benchmark S&P 500 on the weekly chart below, the substantial relative weakness of $ITB becomes clearly apparent:

While the S&P 500 SPDR ($SPY), a popular ETF proxy for the S&P 500, has been in a clear uptrend with a series of higher highs and higher lows, notice that $ITB has been trending lower, setting lower highs and lower lows.
This concept of relative strength trading, detailed Trading ETFs: Gaining An Edge With Technical Analysis, is a pretty simple concept, but highly effective. Stocks or ETFs that hold up better than the major indices during a broad correction are usually the first to break out when the market becomes healthy again.
Conversely, stocks or ETFs trending lower while the major indices are moving higher are usually the first to roll over when the broad market pulls back. This means that $ITB is a great short selling candidate IF the market goes into correction mode. However, as approximately 80% of stocks follow the direction of the broad market, we are not interested in selling short as long as the broad market remains in an uptrend.
On a separate note, our position in Guggenheim Solar ETF ($TAN) continues to hold near its high. Since last month's original buy entry in The Wagner Daily newsletter, the ETF trade is presently showing an unrealized price gain of more than 24%.
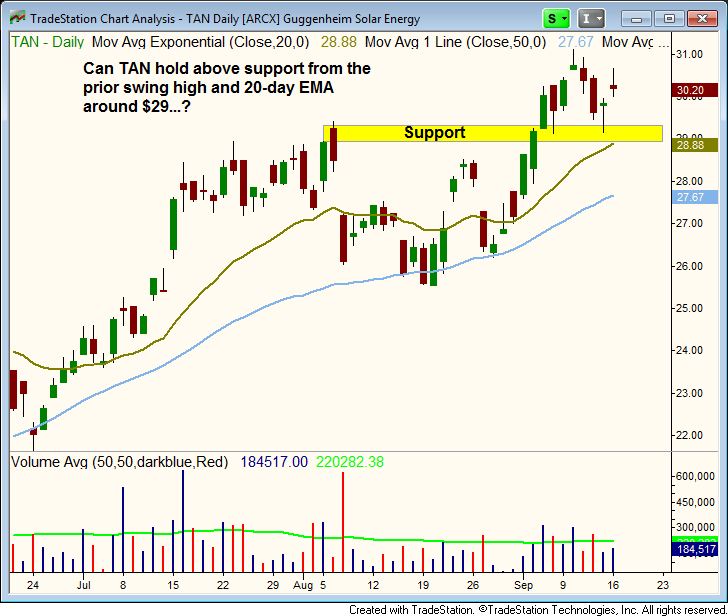
Although price action in $TAN remains bullish, we are now raising the stop in Guggenheim Solar Energy ($TAN) to protect against the possibility of a false breakout. Our new stop price is just below the $29 area, where there is support from the 20-day exponential moving average and prior swing highs within the base:

Deron Wagner is the Founder and Head Trader of both Morpheus Capital LP, a U.S. hedge fund, and MorpheusTrading.com, a trader education firm.
|