NASDAQ Commentary
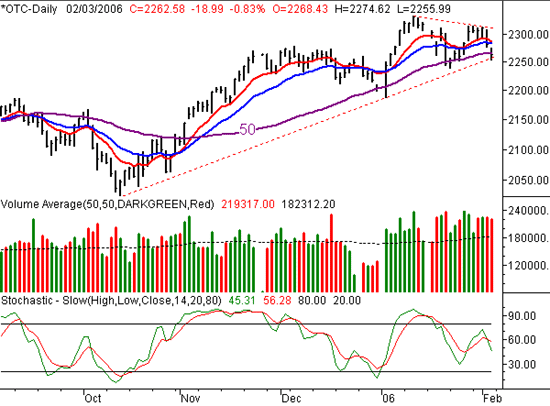
The NASDAQ's bullish move ended up not turning into a streak, as the composite index pulled back by 1.81% last week. That 41.65 point sell off left the NASDAQ at 2262.58, and under a few key moving average lines. Slowly but surely, the bears are getting their claws into the buyer's efforts.
The close under the 50 day average (purple) is by far the biggest blow to the NASDAQ's chart. This isn't the first close under the 50 day line we've seen this year, but this one follows a rather suspect lower high. Two weeks ago it looked like we might be on track to surpass the 52-week high of 2332.92, from early January. Last week, we didn't even make an attempt. Instead, we spent all last week selling stocks.....and not on light volume. The boundaries are really being pressed here too.
The long-term support line that extends all the way back to October is basically on its last leg. In other words, a little more downside, and it will no longer be support. If that happens, it will also coincide with a lower close under the 50 day average. If that happens - and it could as early as Monday - that should be enough technical damage to finally send the NASDAQ lower. It should be a fairly typical correction. Any close under Friday's close of 2262 would serve as that official sell signal.
NASDAQ Chart

S&P 500 Commentary
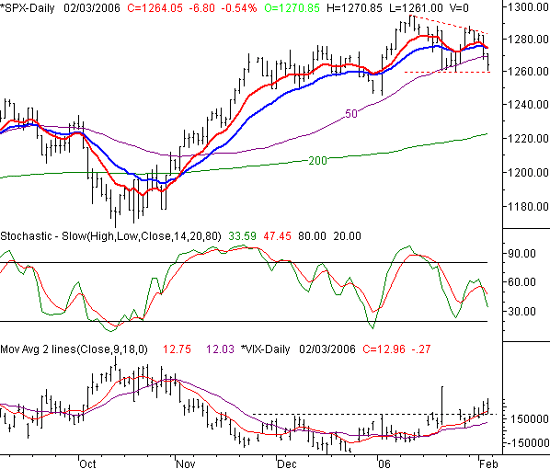
The S&P 500's close at 1264.05 last week was the result of a 1.53% dip, or 19.65 points worth of loss. That pretty much mirrors the NASDAQ's woes, and volume here was up slightly as well. In other words, there's not a whole lot to add about the SPX chart (so we won't).
One thing we want to focus on here is the fact that the SPX is just a hair away from making a lower significant low. We plotted a horizontal resistance line at last week's low of 1259.40. Friday's low was 1261.0. It will only take a two point dip into the red ink to change the complexion of the market in a rather big way. Note that we've already made a lower high (like the NASDAQ).
The only other thing we'll highlight is that the VIX is also trending higher now, which also points to bearishness. And the key word is 'trending'. The VIX spiked to 14.56 in the middle of January, and we thought that may be the beginning of a big upwards move for the VIX (and a downward move for stocks). However, that ended up being a little too much, too fast. The VIX faded after that, and stocks drifted higher. Now that both charts have stabilized though, the actual trends have become discernible.
Again, we don't expect any correction to be out of the ordinary. Watch for that close under 1259.
S&P 500 Chart

Dow Jones Industrials Commentary
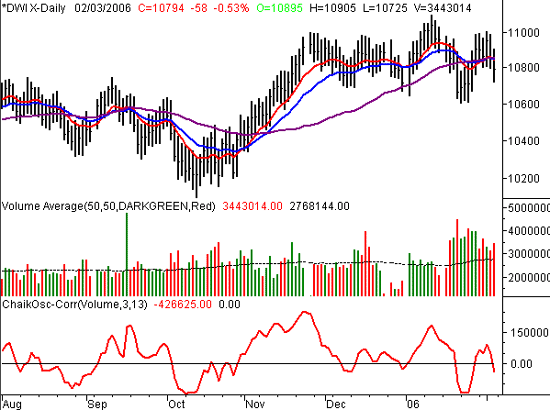
The Dow's 1.04% selloff means the blue-chip index closed at 10,794 last week.....113 points under the previous week's close. Again, that's in-line with the other indices. That's also why we think there's a high likelihood of a correction on the horizon - all the indices participated in the weakness proportionally. We had mentioned a couple of week's ago that we'd look for rotation into or out of the Dow Jones Industrials (relative to the NASDAQ) as a hint of defense or offense in investors minds. However, we've not seen one gain at the expense of the other between now and then. Instead, both indices pushed higher two weeks ago, and then sold off on higher volume last week. In other words, this dip has some breadth and depth, which of course has bearish qualities.
The Dow's volume, speaking of proportional, was bearish enough to pull the Chaikin line back under zero just a few days after it crossed above the zero line. The Dow also closed under the 50 day line too.
Dow Jones Industrials Chart

Price Headley is the founder and chief analyst of BigTrends.com.