| The Wagner Daily ETF Report For October 4 |
| By Deron Wagner |
Published
10/4/2013
|
Stocks
|
Unrated
|
|
|
|
The Wagner Daily ETF Report For October 4
The major averages registered a clear "distribution day" yesterday, with the major indices closing lower by 0.8% to 1.1%, and on higher volume. It was the first true session of institutional selling across the board in some time (most indices closed near the bottom third of the day's range).
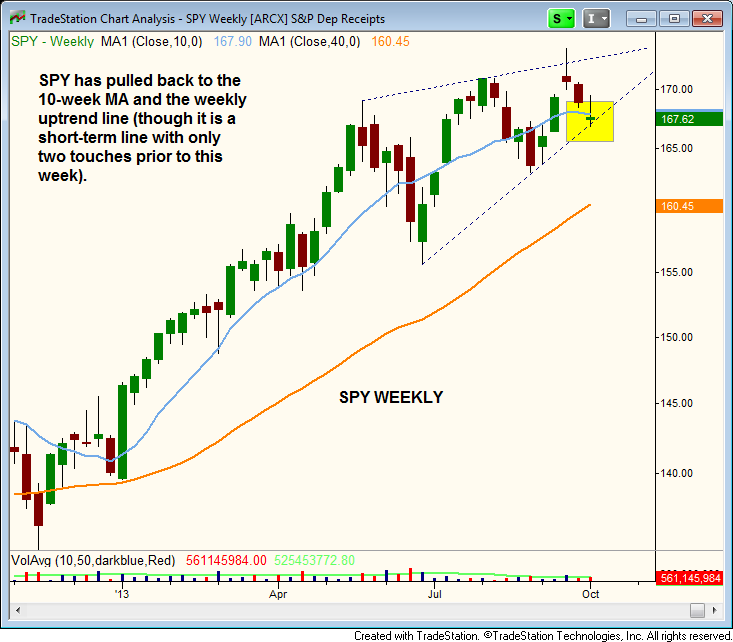
Despite yesterday's sell-off, our rule-based market timing model remains in "confirmed buy" mode because the NASDAQ Composite is still in good shape and the S&P 500 has pulled back into support on its weekly chart (as shown below). Some leading stocks were knocked around a bit on a pick up in volume, but there was little to no significant technical damage done to the charts.
As mentioned above, the S&P 500 ETF ($SPY) has pulled back into a decent support level on the weekly chart. This week's action has "undercut" the 10-week moving average and touched the uptrend line. If it holds, the price will create the third touch needed to validate the trendline:

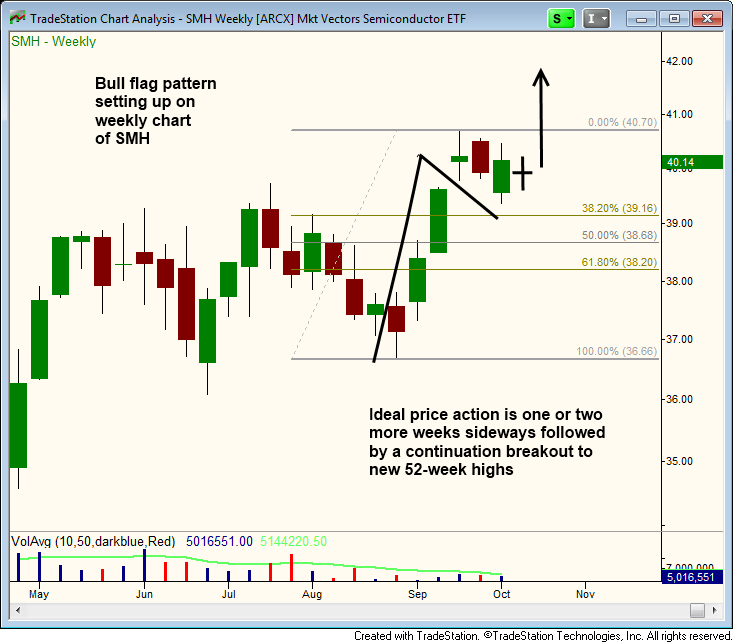
After a strong surge off the August lows, Semiconductor HOLDRS ($SMH) has been in pullback mode for the past two weeks.
If the price action continues to consolidate above the 38.2% Fibonacci level connecting the last swing high and low on the weekly chart below, then we could see a bull flag type pattern develop.
With bull flags, we love to see symmetry. If the pole section of the flag takes 5 weeks to form, then the flag portion should take no more than 3 to 5 weeks (maybe even 6) before breaking out. In the case of $SMH, one or two more weeks sideways would be ideal, followed by a breakout to new highs on the year:

Deron Wagner is the Founder and Head Trader of both Morpheus Capital LP, a U.S. hedge fund, and MorpheusTrading.com, a trader education firm.
|