| The Wagner Daily ETF Report For October 14 |
| By Deron Wagner |
Published
10/14/2013
|
Stocks
|
Unrated
|
|
|
|
The Wagner Daily ETF Report For October 14
Stocks followed through on Thursday's clutch reversal action with another day of solid gains, especially in the Russell 2000, which closed up nearly 1.4%. The S&P 500 rallied 3.5% off the lows of the week to close well above the 50-day moving average, and as of last Friday's close, all major averages have reclaimed their respective 50-day moving averages.
Turnover was lighter once again, so technically neither the S&P 500 or NASDAQ has yet to produce an accumulation day. However, we noticed plenty of bullish reversal candles on the weekly charts of leading stocks and major averages.
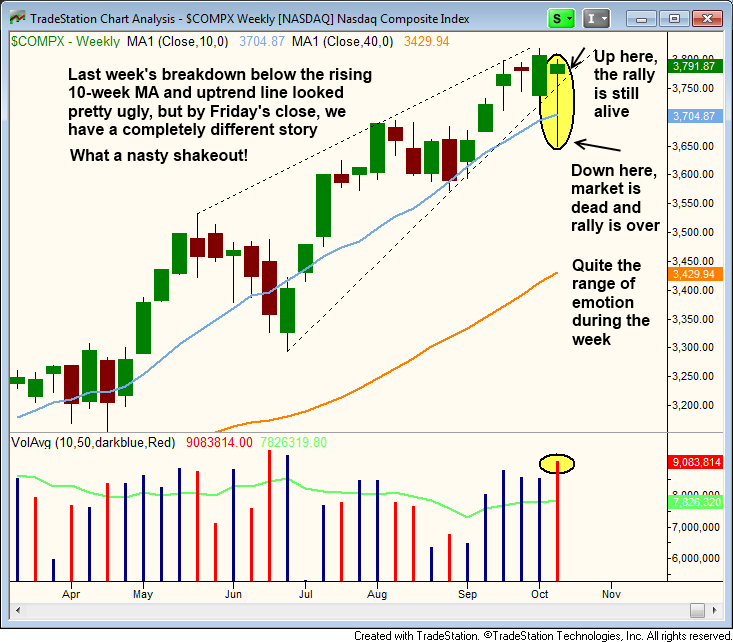
The weekly chart of the NASDAQ Composite below shows the bullish reversal action, after an undercut of the uptrend line and 10-week MA. Thursday's gap up was very strong, and probably left a ton of traders in the dust after getting stopped out earlier in the week:

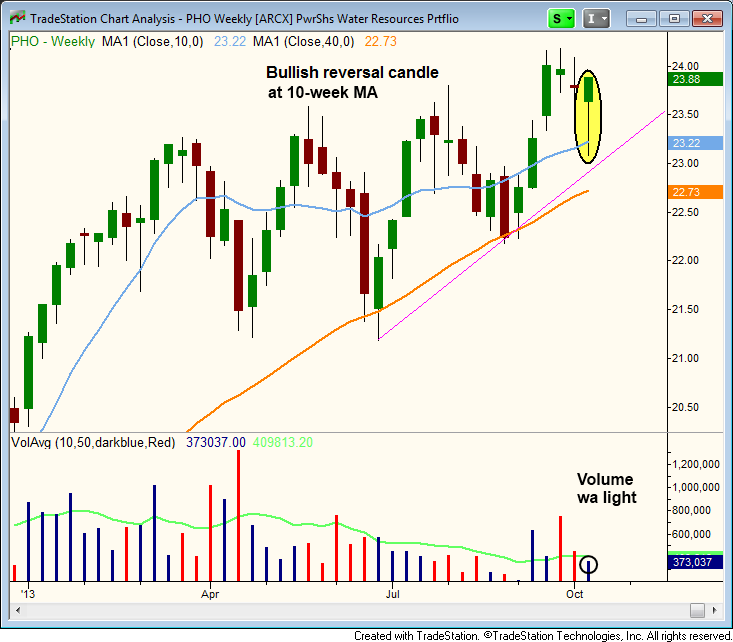
Along with NASDAQ Composite, we saw bullish reversal action in Powershares Water Resource Portfolio ($PHO) as it bounced off the 10-week MA and closed near the highs of the week.
We continue to hold $PHO in the model ETF portfolio of The Wagner Daily after a breakout buy late last month. If the $23 support level can hold, then we should eventually see a breakout to new 52-week highs:

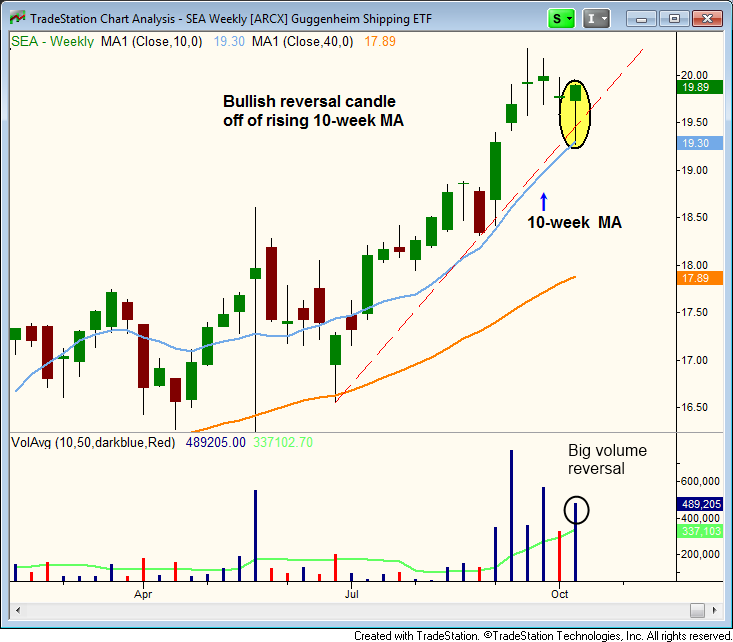
After recently breaking out from a long term base at $19, the Guggenheim Shipping ETF ($SEA) pulled back to support of the rising 10-week MA and held, forming a bullish reversal candle on the weekly chart below. The 10-week MA is usually the first big support level for a stock/ETF that has lost steam after a big breakout, and has pulled back in for a few weeks.
In a strong uptrend, ETFs or stocks will often find support at the 10-week MA three to five times during an extended run, so these levels are typically low-risk entry points. Although we are not placing $SEA on today's official "watchlist," it is a potential buy over last week's high (plus a few cents to avoid a false trigger):

We added one new position to the ETF portfolio on Friday in $IYZ, which broke the downtrend line of the consolidation and closed out the week strong.
Deron Wagner is the Founder and Head Trader of both Morpheus Capital LP, a U.S. hedge fund, and MorpheusTrading.com, a trader education firm.
|