| The Wagner Daily ETF Report For October 18 |
| By Deron Wagner |
Published
10/18/2013
|
Stocks
|
Unrated
|
|
|
|
The Wagner Daily ETF Report For October 18
The leading market averages put in another solid day of gains, led by a 0.9% move in the small cap Russell 2000. The S&P 500 and NASDAQ Composite also closed with respectable gains of +0.6%. The Dow Jones continues to struggle, as it closed slightly negative on the day but basically flat at -0.1%. The divergence in the Dow is a concern, but not in the short-term, as we feel there is enough strength in leadership stocks to lift the market higher for the next 4 to 8 weeks.
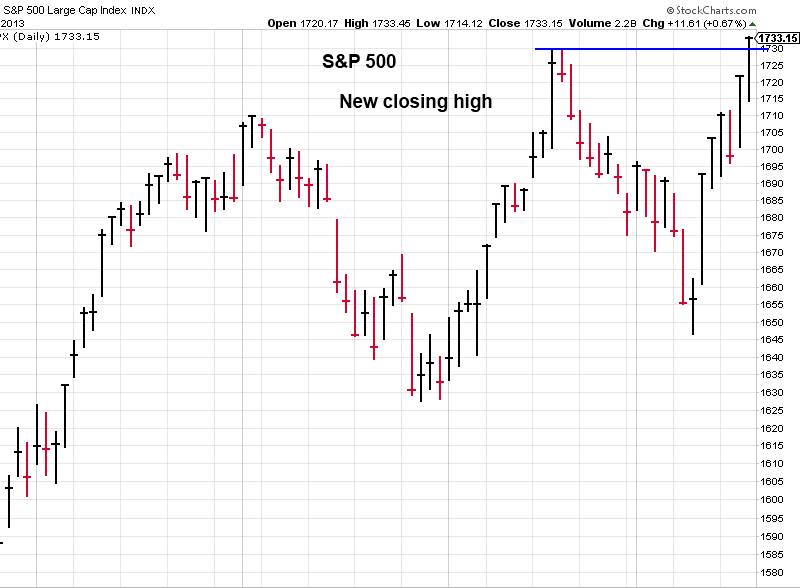
Yesterday's advance in the S&P 500 put the benchmark index at a new closing high for the year, which is a great sign considering where this index was only six sessions ago!
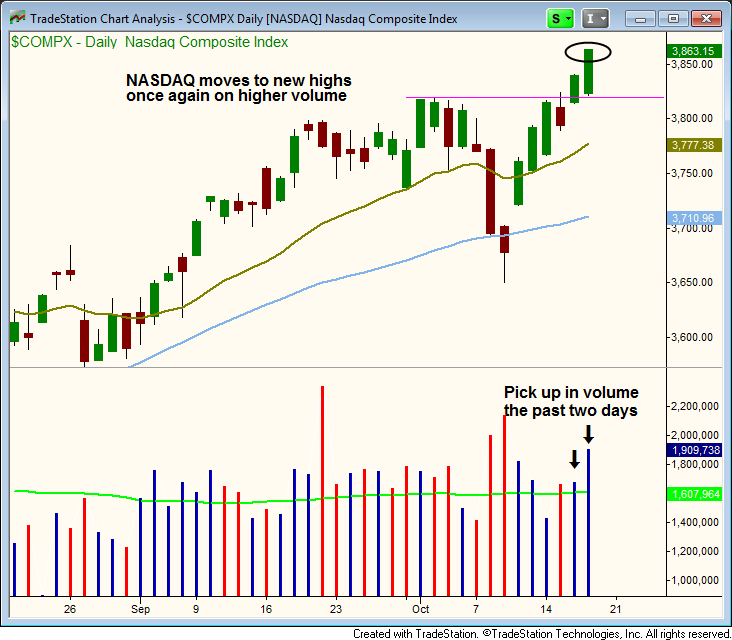
The tech-heavy NASDAQ continues to extend above the prior swing high, and has rallied quite substantially since our September 6 commentary that projected another breakout to new highs in the NASDAQ.
The following daily charts of the S&P 500 and Nasdaq Composite show the current bullishness in the market:


As ETF trend traders, we focus on ETFs that are making higher highs and higher lows, along with patterns that indicate relative strength to the S&P 500.
Pattern relative strength is a pretty simple tool one can use to eliminate certain groups from a watchlist. For example, any ETF that has broken out over the past few weeks has great relative strength to the S&P 500 because it has rallied to new highs ahead of the benchmark index. On such example is Guggenheim Solar Energy ETF ($TAN), which recently netted us a 44% gain.
ETFs that are presently breaking out this week, alongside of the S&P 500, are also decent buys and may eventually outperform during the rally. These ETFs may not be as good as buying one with relative strength on a pullback, but can still offer decent alpha. One such example is Direxion Daily Semiconductor Bull 3X ($SOXL), which we are currently long in The Wagner Daily.
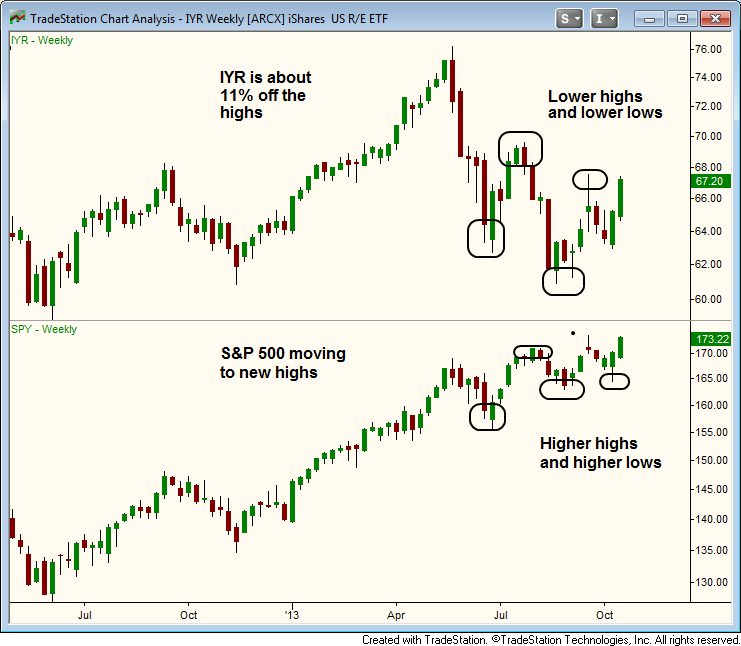
While ETFs that broke out ahead of the S&P 500 are the best buy candidates, and some breaking out now may be okay, it is best to avoid industry sectors that are lagging behind.
Two such examples of sectors with relative weakness are Homebuilders and REITs. The chart below compares the price action in a Real Estate ETF ($IYR) vs. the S&P 500 ETF ($SPY):

There are many ways to determine the best ETFs and stocks to buy, but this method of assessing relative strength of an industry sector by comparing its price action to the S&P 500 is a quick and easy way to narrow down your selection of potential ETF or stock buy candidates.
Deron Wagner is the Founder and Head Trader of both Morpheus Capital LP, a U.S. hedge fund, and MorpheusTrading.com, a trader education firm.
|