NASDAQ Commentary
The indices opened stronger today, after yesterday's sizable selloff. But, they've only managed to tread water since that moderately higher open. The NASDAQ is up 6.8 points for the day (+0.30%), and currently trading at 2251.75. In terms of the bigger picture, that's just not going to cut it for the bulls - the index is still down 10.8 points (-0.48%) for the week. Plus, after the last few days, there are multiple barriers that should keep weighing in on the market.
For starters, even with today's gains, the NASDAQ Composite is under all the key short-term (10 and 20 day) and intermediate-term (50 day) moving averages. In fact, barring a miracle within the next 4 hours, we're on track to make the fourth straight close under all those lines, for the first time since October. We've been under those lines briefly since then, but this is the first time we've stayed under them for so long. That's one of the reasons we suspect this selling effort is apt to get a little more traction. (Volume has been tilted towards the bearish side of things as well.)
Additionally, this is also going to be the fourth close under a key support level (red) that extends back to October's low. Again, it illustrates a technical breakdown.
The trump card is - of all things - the fact that the CBOE NASDAQ Volatility Index (VXN) looks like it's starting to roll over again. We've been discussing the VIX (the S&P 500's equivalent volatility index) quite a bit recently, arguing that its rise would coincide with a pullback for stocks - and we're sticking with that argument for now. In general, the VXN and VIX should be pointed in the same direction. Yet on our chart, we can clearly see the VXN has made several slightly lower highs......even though the VIX continues to drift higher (as you'll see on the S&P 500 chart).
Theoretically it's possible for the two to move in opposing directions....it's just not likely. And we think the odds are going to catch up with one or the other soon. Which one? Given that the NASDAQ has made a lower high and as of yesterday a lower low (see chart), we still contend that we're moving into a bearish mode for stocks. We fully expect the same choppiness we've seen for months, as we can see the bulls even fighting today. So, don't read too much into today's gains. Only a couple of closes back above the 10 day line would jump-start the uptrend.
NASDAQ Chart

&P 500 Commentary
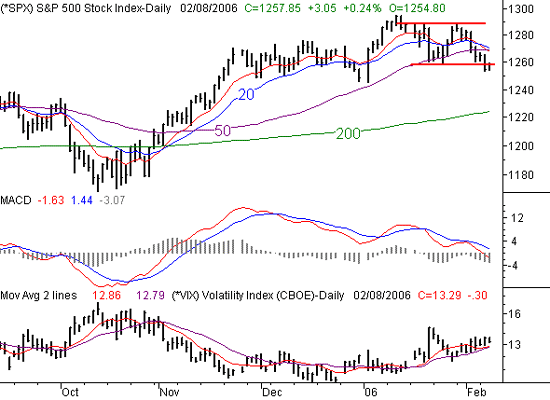
The S&P 500 has also tumbled all of its important moving average lines, and is going to be equally challenged to get back above them, even with today's buying. So far, the SPX is up 3.05 points (+0.24%), leaving it at 1257.85. For the week, this large cap index remains in the red, down 0.5% (-6.2 points).
Like the NASDAQ, the S&P 500 has followed a lower high with a lower low. Unlike the NASDAQ, the S&P is still under that prior low of 1259.40 (from 1/25). Again, we may indeed be seeing a little buying today, but that could have been expected after three days of pretty strong selling. The bulls are just testing the waters, but really haven't liked what they've found. All in all, the direction of the market is still changing. You may just need to take a step back to see it.
We've plotted the VIX here again, since we discussed it so much within the NASDAQ commentary. Although it's in the red today - as stocks are making gains - you can still tell it's been forced higher since 1/27. Like the SPX chart itself, you may have to take a step back to look through all that choppiness and discern that it's moving higher, which remains bearish for stocks.
So what about today's bullish pressure? From this point, we're very interested to see what will happen once the 10 and 20 day averages are retested as resistance. They're both about 10 points above the current trading level, which means the index could make respectable gains before really being presses. Don't fall into that trap - that's just volatility. In fact, based on how erratic trading has been lately, we'd be surprised if we didn't at least retest those short-term averages.
Overall, we remain cautiously bearish, and we want to reiterate that the chop has been excruciating (as well as inconsistent). Pick your entry spots carefully.
S&P 500 Chart

Price Headley is the founder and chief analyst of BigTrends.com.