| The Wagner Daily ETF Report For November 1 |
| By Deron Wagner |
Published
11/1/2013
|
Stocks
|
Unrated
|
|
|
|
The Wagner Daily ETF Report For November 1
Over the past week, funds have been rotating out of the Nasdaq and into the S&P, while leading stocks have been taking a breather. Stocks also declined on higher volume yesterday, causing the main stock market indexes to register a bearish "distribution day."
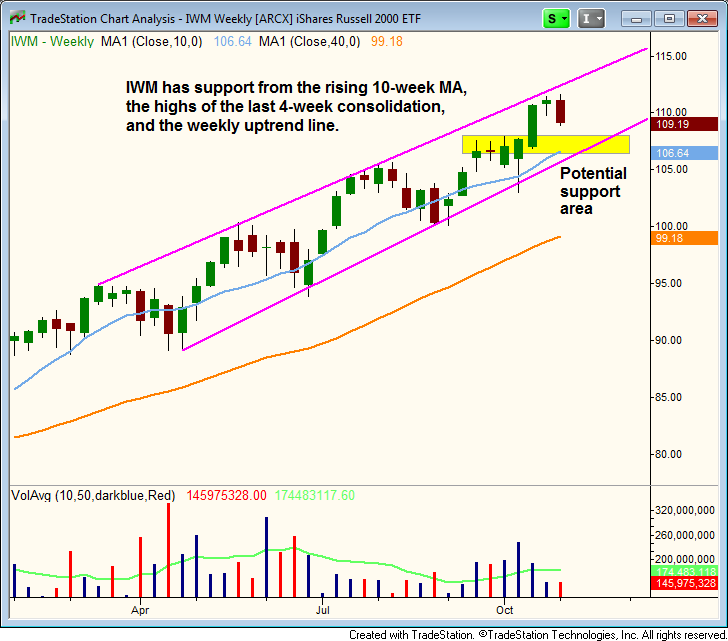
As such, it's a good time to take a step back and look at the weekly support/resistance levels of the Russell 2000 ETF ($IWM) and S&P 500 SPDR ($SPY).
Beginning with $IWM, we see a cluster of support around the $106-$108 area. As shown on the chart below, the weekly channel below is still dictating the price action, so a pullback to that bottom trendline is certainly a possibility. There is also support from the 10-week MA, as well as the highs of the short, four-week consolidation:

To be clear, we are not saying that $IWM will necessarily pullback to the aforementioned support level. Some corrections are shallow, correcting more by time (sideways) than price, which would allow the rising 10-week MA to catch up.
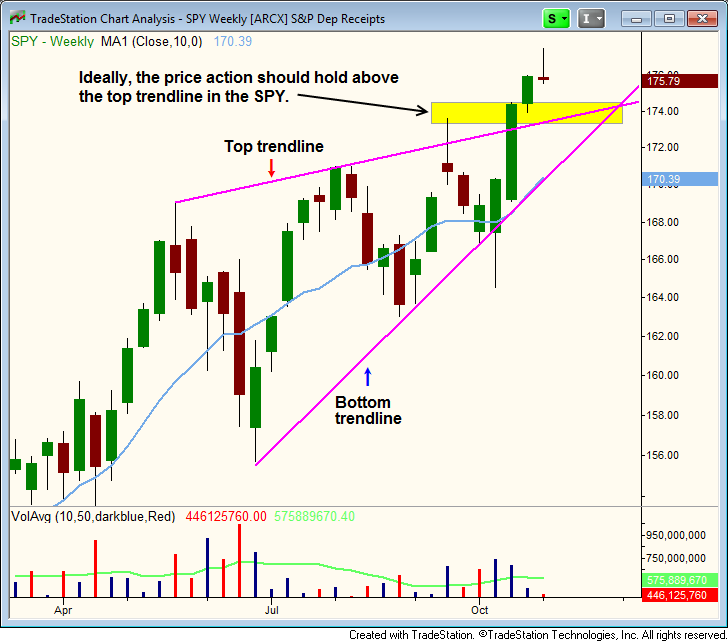
For $SPY, the weekly chart below shows the recent breakout of an ascending triangle type pattern. The top trendline should now serve as support on a pullback, if momentum from the last breakout is to hold.
If the price action is unable to hold the trendline, we could possibly see a test of the rising 10-week MA and bottom trendline:

Recent breakouts in several ETFs we are currently long ($IYZ, $PPA, and $PHO) remain in good shape. Our long position in $XRT remains above the 10-day MA and the breakout pivot level at $83. $EWJ is still range-bound, but the current consolidation is bullish, so the price action may just need a bit more time to move out.
Deron Wagner is the Founder and Head Trader of both Morpheus Capital LP, a U.S. hedge fund, and MorpheusTrading.com, a trader education firm.
|