| The Wagner Daily ETF Report For November 19 |
| By Deron Wagner |
Published
11/19/2013
|
Stocks
|
Unrated
|
|
|
|
The Wagner Daily ETF Report For November 19
An ugly selloff in the final 90 minutes of trading forced most broad averages into negative territory by the close. The Dow Jones and S&P 500 held up fairly well, but the late plunge created ugly bearish reversal candles on the daily charts of the NASDAQ Composite, Russell 2000, and S&P 400.
Overall, yesterday's session was indicative of "churning," which occurs when a market attempts to move to new swing highs intraday, but finishes well off the highs of the session by the close.
Churning often points to stealth institutional selling into strength. However, total volume must increase over the prior session in order to confirm the churning (yesterday's turnover in the NYSE and Nasdaq was lighter).
Since our stock scans for new ETF and stock long setups have dried up lately, we would actually welcome a short-term pullback in the market to produce some shakeout entries.
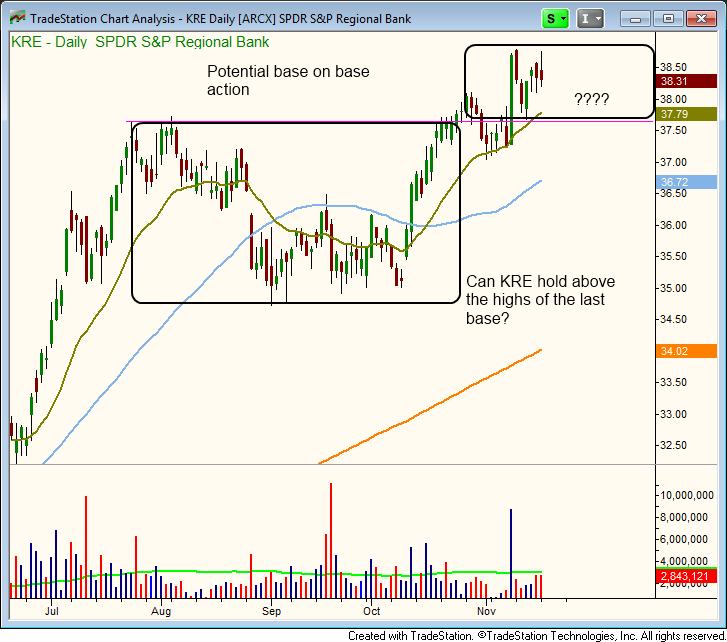
If the broad market does pull in from here, we'd like to see recent breakouts such as the S&P Regional Banking ETF ($KRE) not give up much ground.
As you can see on the chart below, there is support from the prior highs of last August, as well as the rising 10-week moving average (around the $37 to $37.50 area):

The current price consolidation should ideally remain contained within the smaller box in the upper right hand side of the chart. This box is above the bigger box on the left, thereby creating the early stages of a chart pattern known as a base on base).
In confirmed bull markets, the best ETF and stock breakouts emerge from valid bases of support (here's how to spot proper bases of consolidation), but when market sentiment begins easing and stocks lose momentum (at least temporarily), the strongest stocks and ETFs in market frequently form "base on base" patterns (as opposed to falling below new support of their prior highs).
These equities, in turn, become the first to surge higher when the broad market heads higher again.
At its current price, $KRE is not an actionable ETF swing trade setup, but could present a low-risk buy entry on a pullback to support of its rising 10-week moving average, especially if a bullish reversal candle forms on the weekly chart.
Deron Wagner is the Founder and Head Trader of both Morpheus Capital LP, a U.S. hedge fund, and MorpheusTrading.com, a trader education firm.
|