| The Wagner Daily ETF Report For November 21 |
| By Deron Wagner |
Published
11/21/2013
|
Stocks
|
Unrated
|
|
|
|
The Wagner Daily ETF Report For November 21
The S&P 500 SPDR ($SPY) sold off for the third day in the row, finishing 0.4% lower on lighter volume and closing at support of the rising 10-day moving average. If the 10-day moving average is unable to hold, then there is support from the prior breakout level and rising 20-day exponential moving average in the $177 to $177.50 area.
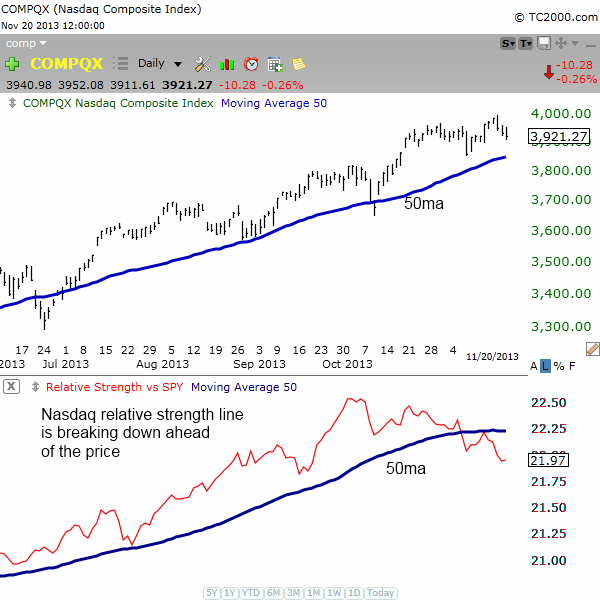
The NASDAQ Composite, which has been relatively weak vs the S&P and Dow is already at support from the 10 and 20-day MAs. If this level is unable to hold, then the next logical support area is the 50-day MA, which lines up with the prior swing low from November 7.
The weakness in leading stocks over the past few weeks suggests the NASDAQ is vulnerable to a short-term selloff to the 50-day MA (exactly when we do not know).
The chart below shows the NASDAQ's relative strength line vs the S&P 500. Notice that the RS line is already below the 50-day MA, while price of NASDAQ is still above. The RS line has also made two lower highs and two lower lows, signaling a trend reversal in relative strength:

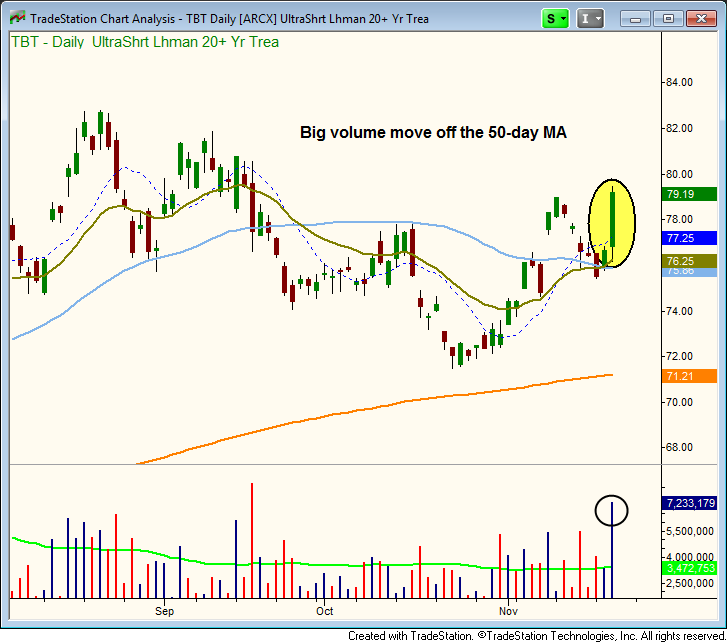
ProShares UltraShort Lehman 20+ Yr ($TBT) looks to be resuming its new uptrend after a three-month break, as yesterday's strong advance was confirmed by heavier than average volume.

The bullish surge off the 50-day MA is a buy signal, so we are monitoring $TBT for a low risk pullback entry within the next 3 to 10 days to the rising 10-day MA. The 50-day MA has just flattened out and has yet to turn up, but the 20-day EMA is now above the 50-day AM, so all three averages are in proper order (20>50>200).
The fact that leadership stocks and the top ETFs have failed to produce quality buy setups as of late suggests that the market may be headed for a few weeks of choppy action. If the majority of stocks and ETFs find support over the next few weeks and begin to put in higher lows within a base, then the market may be able to push higher in Q1-2014. However, if leading stocks begin to crumble in numbers, then the market could be vulnerable to a sharp selloff, somewhere in the 6% to 10% range off the current highs.
A few months ago we were heavily long and there were plenty of setups to buy, but market conditions have changed the past few weeks, and there simply isn't much to do right now.
When there isn't much to do we go into S.O.H. mode ("sitting on hands"). Sometimes it is best to do nothing, as buying with little or no conviction can lead to over-trading, which basically happens when a bunch of small losses adds up to one big loss.
Deron Wagner is the Founder and Head Trader of both Morpheus Capital LP, a U.S. hedge fund, and MorpheusTrading.com, a trader education firm.
|