NASDAQ Commentary
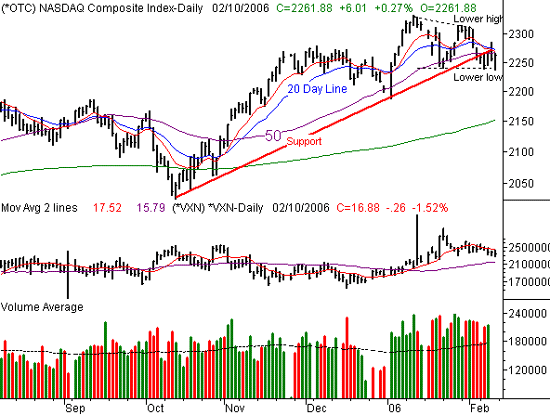
The NASDAQ ended up closing right in the middle of its bar this past week, ending Friday at 2261.88. The high was 2284.52, while the low was 2235.41. Did we mention that the open was at 2284.52? That doji bar suggests that traders are a little uncertain about what to do next, as does the net change over the last week.......the NASDAQ closed only 0.7 points lower than the previous week. Yes, it's a relatively untelling chart. We'll have to dissect it carefully this time.
Despite Friday's gain, the NASDAQ still finished under all the key short-term averages. That's why we still have to lean with the bears for the time being. Plus, we also made a lower low.....and have yet to get back above that key support line we fell under several days ago.
On the other hand, the NASDAQ Volatility Index (VXN) has drifted lower the last week. That's certainly not bearish for stocks, although it's not exactly bullish either. We'll just leave it out there as a red flag. If the composite really is in a downtrend, the VXN will have to start creeping higher soon.
From here, we're plotting short-term support at 2235. That's the low we hit Friday. However, it's only about 25 points away, so we also want to draw a support line at 2190 - the low for the year that we saw made on January rd. As for resistance, the 10, 20, and 50 day averages are all parked right around 2270 (which also happens to be very close to Friday's high). Only a couple of closes above that level would put us in the bullish camp, while we need to see a close under 2235 to get any more bearish.
NASDAQ Chart 
S&P 500 Commentary
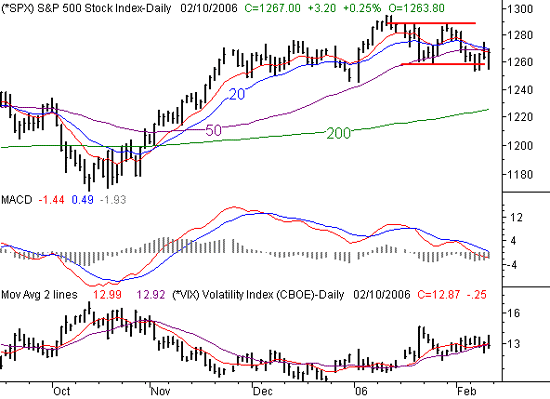
The S&P 500 managed to make a small gain last week, closing 2.95 points (+0.23%) higher to end Friday at 1267.00. All of that gain, though, was actually made on Friday. Yet, we also saw the SPX inch towards lower lows, and fail to get back above key short-term moving average lines. So like the NASDAQ, we still have to side with the bears here.
Like the NASDAQ, the S&P 500 also found resistance at the conglomerated 10,20, and 50 day lines at 1269. So, we remain bearish for the SPX as well. Besides, the MACD chart still is pointed lower. The S&P 500 Volatility Index (VIX), unlike the NASDAQ's, is not actually pointed lower. It's not exactly pointed higher either, though. Rather, it's just been caught in a tight range between the mid-12's and mid-13's. We'll look for a break out of that range to aid us in spotting which direction the market is likely to head next, because right now, it's still a bit of a guessing game.
The only thing we'll add here is that we've seen a series of lower lows and lower highs now. The selloffs seem to be easy to make, while the rallies are strained at best. You may have to take a step back to see that, but the bears really have been in control for a while, albeit it inconsistently.
Support is at 1253, then again at the 2006 low of 1245. Resistance remains at 1270.
S&P 500 Chart 
Dow Jones Industrials Commentary
The Dow ended up being the big winner for the week, gaining 1.16% (125 points) to close at 10,919. We had previously discussed how relative strength in the Dow and weakness in the NASDAQ might represent a shift from speculative names to the safe blue-chips. We didn't see it last week, but this might be a hint of that. What's interesting (and bearish in the bigger picture) is that even though the Dow closed much higher for the week, the volume behind the gain was considerably higher than normal. The point being, the Dow's relative strength may still not be enough to keep the market propped up, especially if the NASDAQ continues to deteriorate.
Nevertheless, the Dow closed above its 10 day line, and actually made a bullish MACD cross late last week. The volume behind the move wasn't bad either, so we have a bit of a quagmire. Although we remain impressed by the Dow's strength, we don't think it will be able to fly solo in a bullish way. It may fare better than other indices if the market stays weak, but it will still suffer. Resistance remains at 11,000, but we wouldn't bet against the Dow until we saw a close under 10,850. That's where the 10, 20, and 50 day lines are all clustered.
Dow Jones Industrials Chart 
Price Headley is the founder and chief analyst of BigTrends.com.