| The Wagner Daily ETF Report For January 7 |
| By Deron Wagner |
Published
01/7/2014
|
Stocks
|
Unrated
|
|
|
|
The Wagner Daily ETF Report For January 7
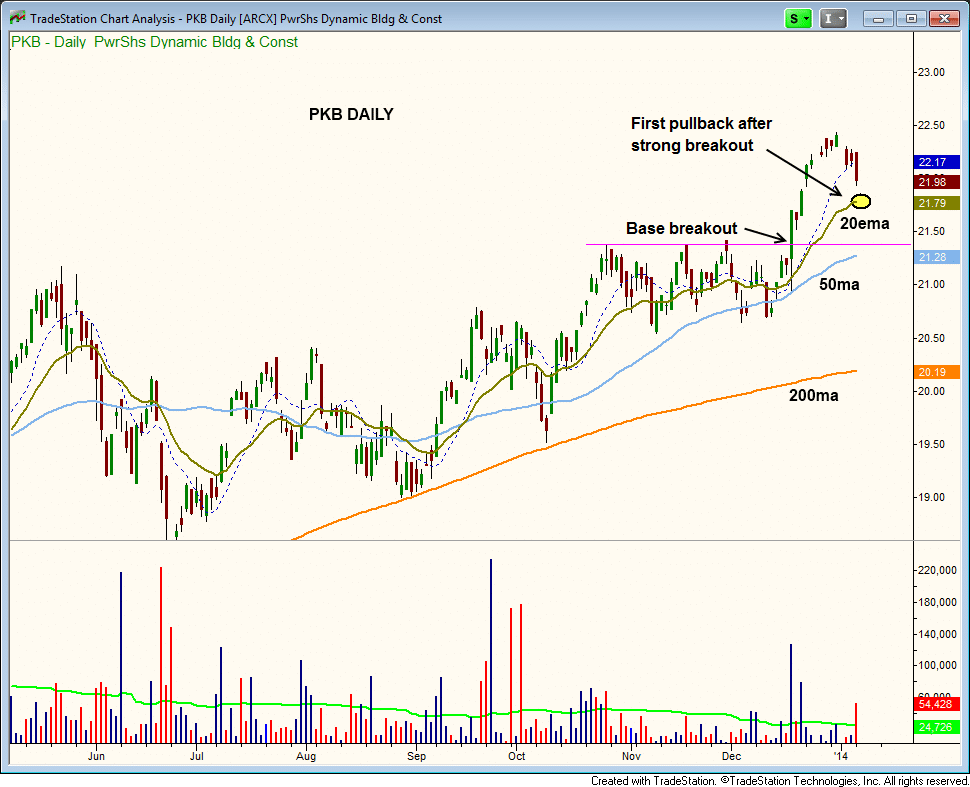
After breaking out from a strong base in December, PowerShares Dynamic Building & Construction ETF ($PKB) has stalled out and is now in pullback mode. The first pullback after a strong breakout is usually a good spot to add to an existing position, or to establish a new position if the original breakout entry was missed (learn more about pullback buying strategy here). The current pullback of $PKB is shown on the daily chart below:

Although $PKB undercut the 10-day moving average (dotted blue line) on Monday, the 20-day exponential moving average is just below. As such, there is decent support in the $21.80-$22 range.
As mentioned in past reports, our favorite swing trade setups are marked by some sort of downtrend line breakout or base breakout that occurs on multiple time frames (daily, weekly, and monthly timeframes). Whenever there is confirmation of multiple time frames, the subsequent breakout can produce explosive price action. Therefore, it pays to dig a little deeper than the daily chart.
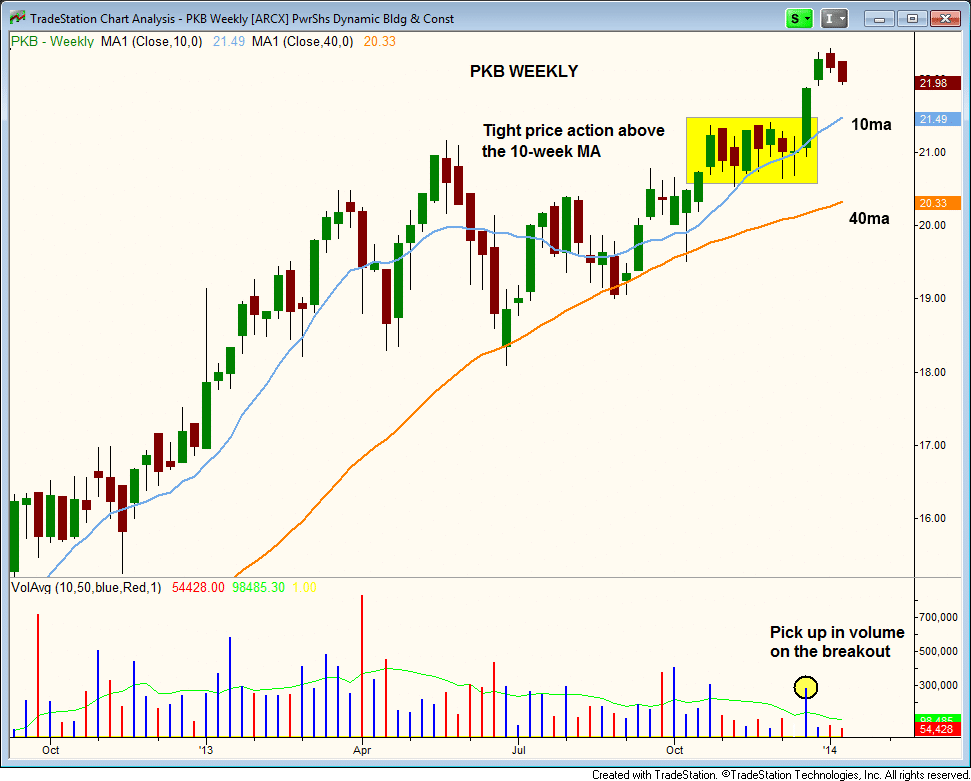
Looking at the weekly chart of $PKB below, we see confirmation of the daily chart breakout. Note that the 10-week moving average (light blue) at $21.49 has already moved above the highs of the prior range. This is a great sign, as this moving average should offer a ton of support (above the last base high) if the price continues to sell off:

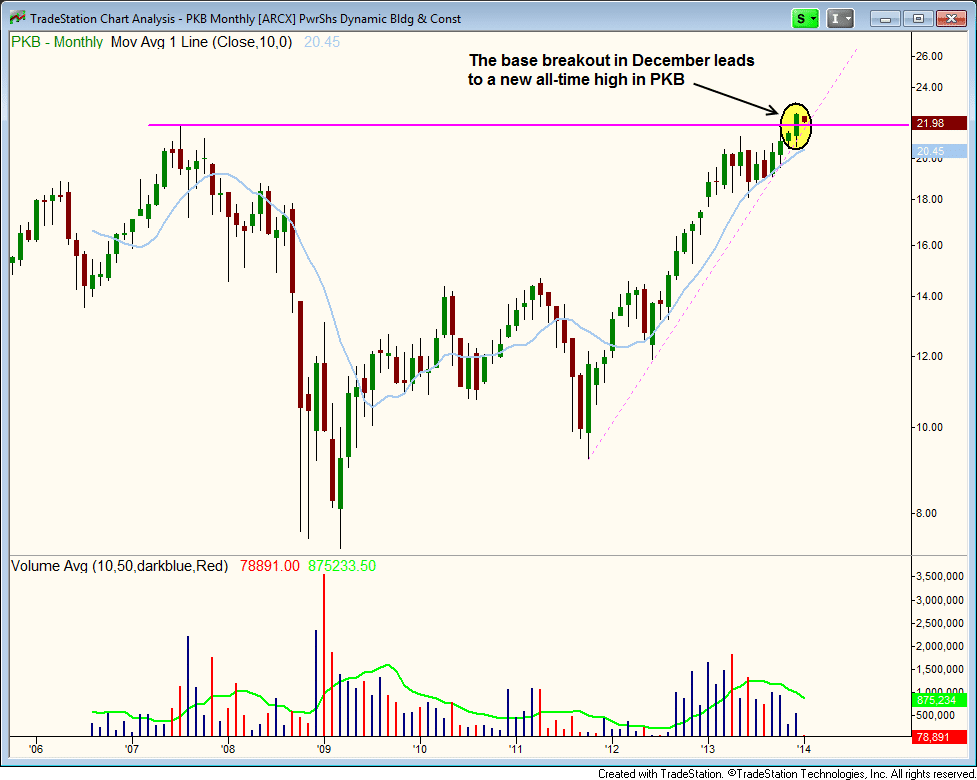
Finally, the long-term monthly chart shows the breakout to new all-time highs:

With a breakout on the daily, weekly, and monthly charts, $PKB is setting up for an explosive run over the next several months. Accordingly, we are now stalking $PKB for potential buy entry. Regular subscribers of The Wagner Daily should note our exact trigger, stop, and target prices for this trade setup in the "Watchlist" section of today's report.
Our existing long position in the Financial Bull 3x ETF ($FAS) is presently up 15% from our November 14 buy entry. Going into today, we have tightened the stop to protect our gain.
On the individual stock side, yesterday's 4.8% gain in Facebook ($FB) means our open position is now showing an unrealized gain of 20.5% since our December 2 buy entry. The $FB chart is setting up nicely for another move to new highs in the near-term, at which time we will tighten the stop to lock in gains as well.
Deron Wagner is the Founder and Head Trader of both Morpheus Capital LP, a U.S. hedge fund, and MorpheusTrading.com, a trader education firm.
|