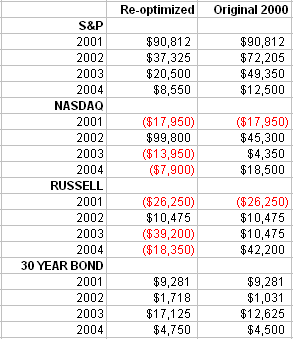
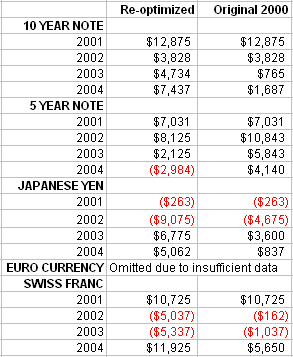
In Part 7, we were looking at optimizing our mechanical trading system every year using the newest data from the preceding year. We did a comparison of optimizing every year from a previous five-year block of time verses using the original year 2000 optimized variables for all of the following four years (years 2001 through 2004). That is, the data was not re-optimized at the beginning of every year using the previous five years of data. This is an abridged chart showing resulting net profits.


Holy Toledo, you might say. What's the point of re-optimizing every year? The original 2000 results across the board are far superior! And that would be a terrific comfortâ€"providing we knew ahead of time that 1996-2000 is the magical data bank to use.
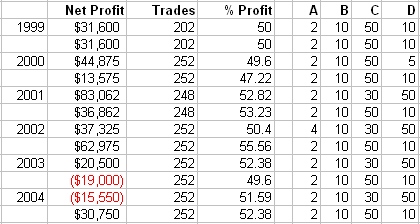
This is part of what is deceptive about “inventing a wheel," and then letting it roll on forever. While it's true that leaving 2000 optimization unaltered for four years does provide virgin data summaries, the “2000-as-ground-zero” idea is arbitrary. Why not optimize in 1998 instead to give us results for the next six years? Here's what we'd see in the S&Ps if we did that.

Optimizing each year may not produce the best numbers we can generate in hindsight, but that's precisely the point. What we've done with our original demonstration is to say “we can get a wide array of positive results in virgin yearly snapshots. Year after year, market after market.” By picking an ideal optimization point, we're attempting to know the unknowable. It's not all that surprising that we could generate better.
Sometimes, though, the yearly altercations actually produce better. That's not surprising eitherâ€"who's to say that our most recent variable isn't better than five or ten years ago?
We are handling our “hazardous materials” (optimization) carefully. Again, the most recent tables we've looked at are all virtual “futures” (virgin data) that were not part of retrofitting process.
P.S. I'd love to receive feedback from you. Please leave a comment or discuss the article by clicking on "Make a comment on this article" below.
Art Collins is the author of Market Beaters, a collection of interviews with renowned mechanical traders. He is currently working on a second volume. E-mail Art at artcollins@ameritech.net.