When the main stock market indexes are in a strong uptrend, it's best to focus on the price action of leading stocks or ETFs and try not to get too caught up in what the major indices are doing intraday.
We do not ignore broad market action, but placing too much emphasis on these charts leads to missed trades, as traders fear buying at the top and are unable to "pull the trigger" in a good setup.
The way to avoid becoming too index-oriented is to have a solid, rule-based trading system in place that allows you to identify bullish stock or ETF patterns. When our stock scans produce many bullish patterns, it is a sign that the broad market could be headed higher.
By letting individual stock charts dictate what we do, we are able to trade what we see, not what we think.
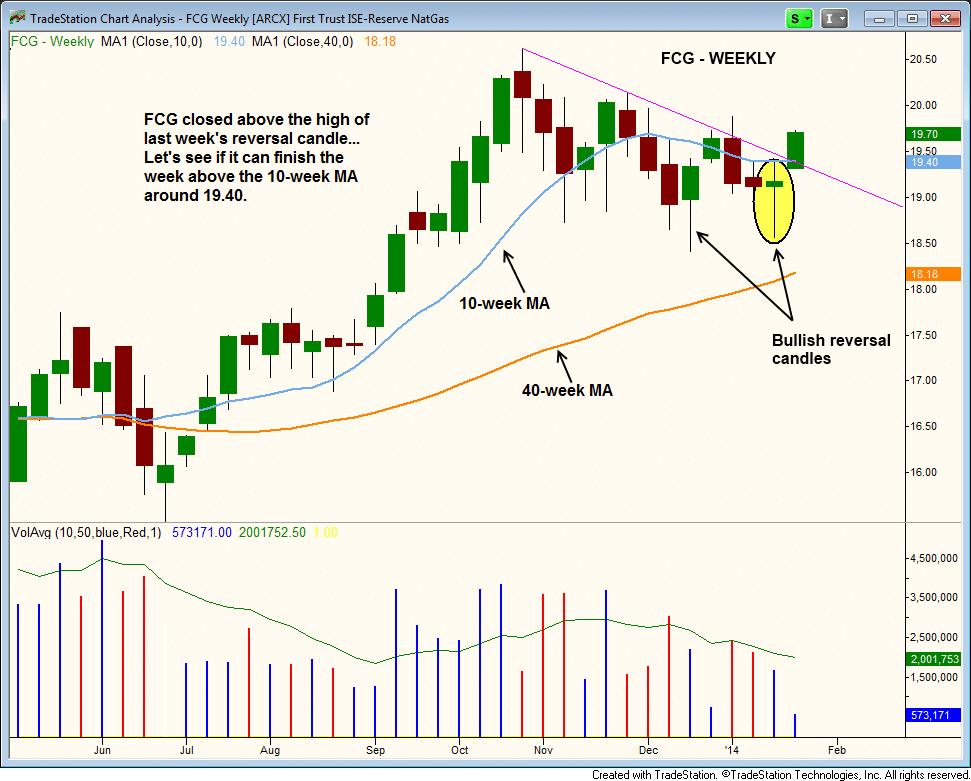
The energy sector was strong yesterday, as First Trust ISE Revere Natural Gas ETF ($FCG) jumped 2.8% on above average volume volume. The ETF also closed above both the 10-week moving average and the high of last week's bullish reversal candle.
Nevertheless, it is just the beginning of the week, so the price action will have to hold up by Friday to confirm the breakout on the weekly chart. Since the volume was strong, we are adding to our existing open position.
If you're a subscriber, please see today's Wagner Daily watchlist for our exact entry, stop, and target prices for this trade setup:

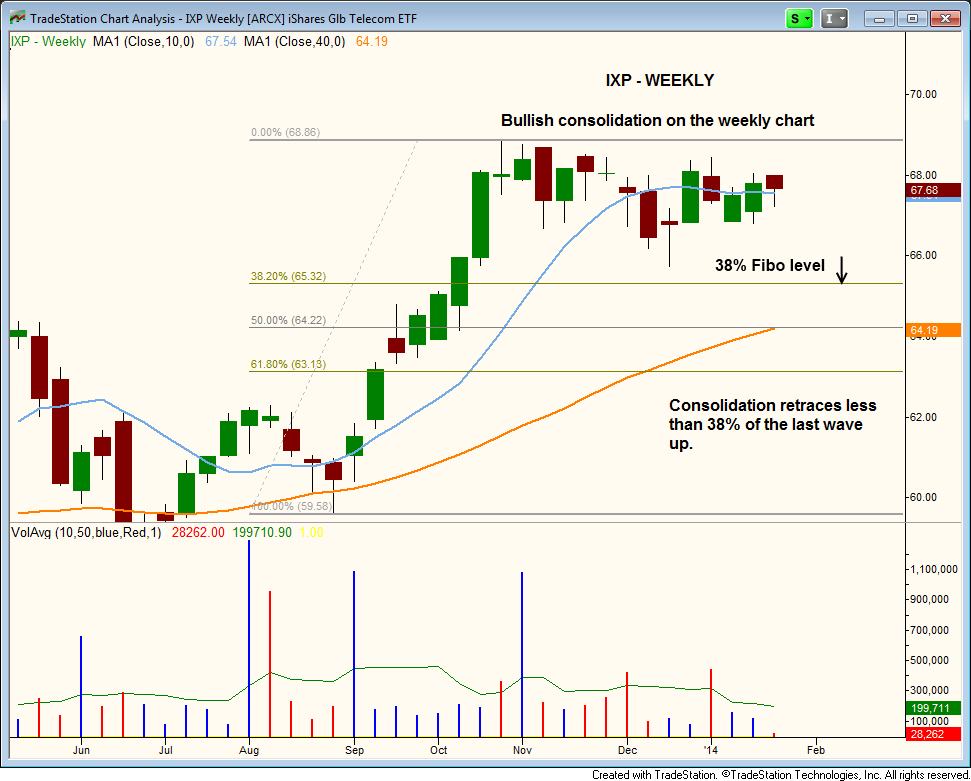
After a strong, seven-week rally off the 40-week moving average, iShares S&P Global Telecommunications ETF ($IXP) has been in consolidation mode since last October. As shown on the chart below, the current consolidation has given back less than 38% of the last wave up, which is quite bullish.
The past three weeks of price action have been pretty tight, hovering around the 10-week MA. Eventually, a volatility contraction will lead to a volatility expansion, though not always to the upside:

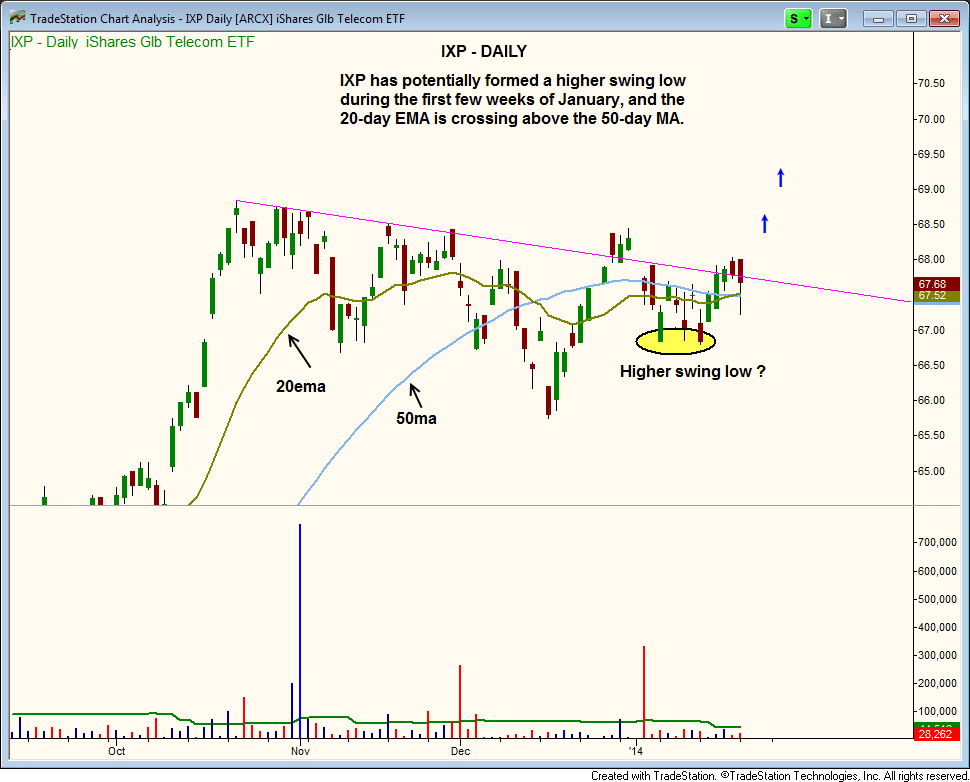
Zooming into the $IXP daily chart time frame, we see a potential "higher low" in place. This low is not officially a higher swing low until the price action clears the last swing high:

Tuesday's reversal candle could also offer another higher low within the base....if it holds. Higher lows show a tightening of the price action, which is usually a bullish sign after a lengthy consolidation.
A breakout above the dirty downtrend line drawn on the daily chart below is a buy entry. We call it a dirty downtrend line because there are a few bars that violate the line. Drawing trendlines is more about common sense than some rule in a technical analysis book. Whichever line has the most touches is the one we usually go with (keep it simple).
As with $FCG, our exact trade details for the $IXP swing trade setup are noted in the watchlist section of today's swing trading report.
Deron Wagner is the Founder and Head Trader of both Morpheus Capital LP, a U.S. hedge fund, and MorpheusTrading.com, a trader education firm.