The markets' dip into the red this morning was quickly wiped away with some positive comments from Bernanke. But that bullish effort has faded too, leaving the indices just a hear above breakeven levels for the day. However, it's still just enough to get the market above some key moving average lines. The question is whether or not we can stay here. It's expiration week, which means we could be all over the map between now and then. A lot of scrutiny is on order for the rest of the week.
NASDAQ Commentary
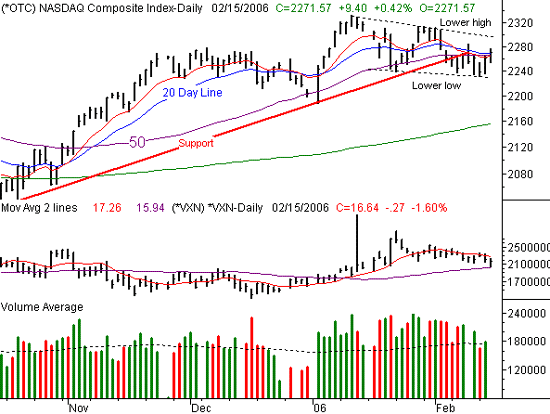
As of right now, the NASDAQ is up 9.7 points (+0.46%) for the week, and up 9.4 points (+0.42%) for the day. That's enough to push the index back above the 20 day line at 2269. That's technically at least the beginning of bullishness, if we can stay there. The sellers are already striking back after we reached a high of 2277.13. All the same, if we close above that 2269 mark, that will be the first part of a technical buy signal. The second part would be an even higher close. As you know, though, back-and-forth movement has been the norm lately, so we have little faith that the NASDAQ can actually get any traction this time around. If we see a close above last week's high of 2284.52, then we might have a little more confidence. Until then, we're not biting. We've just seen too much bearishness in the bigger picture take that bait.
And what is that bearishness exactly? A series of lower highs, and now, lower lows. This bearish trading range is marked with dashed lines on the chart. As you can see, there's plenty of room to bounce around in the short-term, and still be in a longer-term downtrend. The upper edge of that zone is currently at 2297 and falling, which is yet another resistance area (even if we do manage to get past 2284.52).
In the meantime, be patient. Where we close today will be important, but where we close for the week will be even more important. The combined 10, 20, and 50 day lines clustered around 2268 will be the make-or-break point.
NASDAQ Chart

S&P 500 Commentary
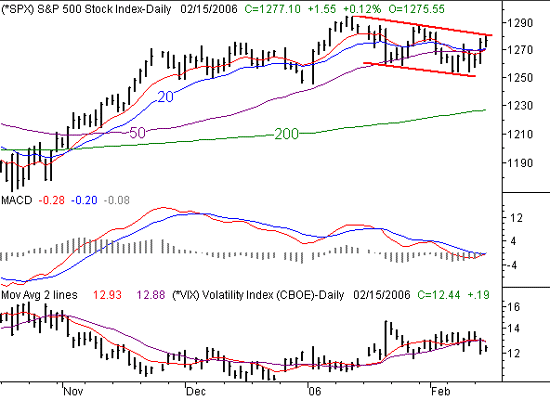
Technically speaking, the S&P 500 is in a much better bullish position than the NASDAQ is. Yesterday's strength was enough to force a close above the 10 and 20 day line at 1270, and we've seen an even higher high today. So we're forced to be a little at odds with ourselves. Technically it's bullish, especially when you throw on the fact that we have a bullish MACD crossover as well (and a VIX crossunder, to boot). Yet, we're a little suspicious anyway.
The fact of the matter is that we made similar crosses of the 10 and 20 day averages is early January and late January, and none of those went anywhere. Maybe this time will be different, or maybe not. We're just not going to over-react until we have a good reason to.
In fact, on the SPX chart, we can see that bearish support/resistance zone that's also plaguing the NASDAQ (bold red lines). The only difference here is that the S&P 500 just bumped up into that resistance line with today's high of 1281.0. So, the bulls really may be at the end of road for the time being. In any case, that's the line we're watching most closely here - 1281. A close above it would at least get us interested in being bullish, but not much else would.
S&P 500 Chart

Dow Jones Industrials Commentary
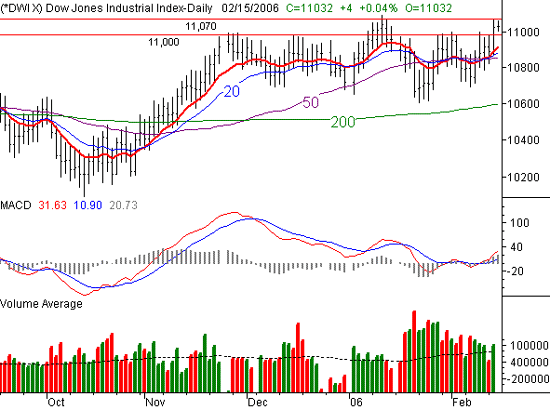
Tired of hearing about 11,000 and the Dow? Well, it's still a major factor, but we want you to add 11,070 as a critical line too. That's about where the Dow has been topping out with each pass past 11,000. Unless we can actually break past that mark, we'll be skeptical of the Dow's recent strength too....even though the chart is technically pretty bullish.
That's a bit bold too, given that the volume as well as the momentum has been pretty positive here over the last few days. However, the current market environment may be the kind that really separates the speculative names from the old-school blue chips. Don't be surprised if the Dow holds up while other indices don't, at least on the short run. However, a real really would most likely include all the indices equally.
As of right now, the Dow is hovering near breakeven levels for the day, and is up 113 points (+1.0%) for the week.
Dow Jones Industrials Chart

Bottom Line
Needless to say, stocks are at a pivotal point right now. Adding in the volatility that expiration week brings only makes things that much more tricky, so it may pay to wait and see how things shape up over the next couple of days. Keep any eye on those 10/20 day lines, and don't over-react in this highly-choppy environment.
Price Headley is the founder and chief analyst of BigTrends.com.