NASDAQ Commentary
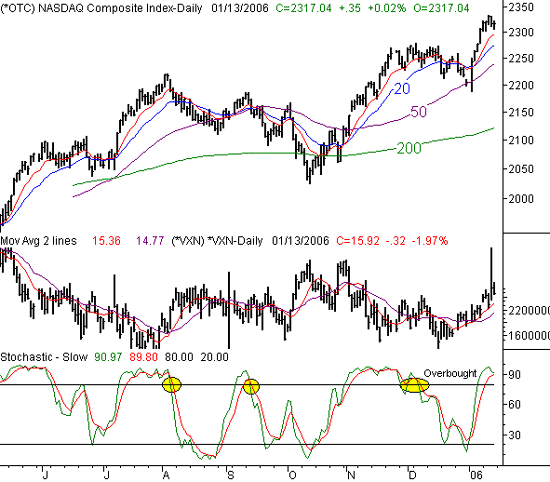
The NASDAQ managed to make an 11.42 point gain (0.5%) last week, but with no thanks to the last two trading days. Things are clearly not as bullish as they were the prior week, but we'd still be hard pressed to say that the index was starting to crumble. In fact, the close at 2317.04 was right in the middle of its weekly range. So, the bullish case could be justified as well as the bearish case. However, we're still looking for a pullback in the wake of the major rally we experienced in very the beginning of the year. Hype and 'performance-chasing' can only go so far, and when the market runs out of that fuel, reality sets in. That may be what we saw happen this past week.
And what is that reality? In simplest terms, the reality is that we're overbought, and traders are looking to start selling to lock in those gains. As our gauge of 'overbought', we're simply applying a stochastics chart. With both the stochastic lines being above 80, we know that we're ripe for a pullback. But as of Friday, we're starting to see both of those lines roll over. The official sell signal will come when both lines are back under 80; it's worth noting that this was an excellent sell signal the last three times we saw it (highlighted).
Additionally, the CBOE NASDAQ Volatility Index (VXN) continued to move higher after hitting a significant bottom a few days ago. Most of the time, a rising VXN coincides with a falling market (see early August and early October). So to see it now just enforces the idea that were due for a dip.
The question, of course, is how far can this index fall? That part still remains unclear, especially following last week's rocket ride (it was the biggest single week for the NASDAQ in years...and it was only a partial week!). That move also broke a major resistance line at 2272, so we have to be generally bullish in the bigger picture. Our bearish slant is only a short-term one....for the time being. A move back towards the 50 day average at 2240 would be a healthy - but tolerable - dip, totaling 77 more points from the current reading. And seeing as how that's where the NASDAQ bounced at the beginning of the year, it's a level worth watching. Once we get there, we'll reassess.
NASDAQ Composite - Daily

S&P 500 Commentary
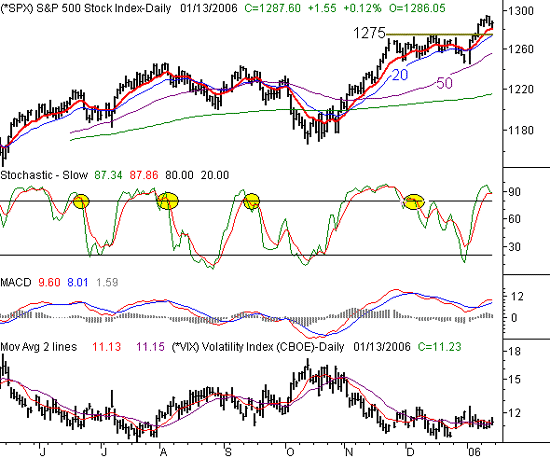
The S&P 500 eked out a 2.15 point gain last week (+0.17%), which is basically flat as far as we're concerned. It had been as high as 1294.90, but fell to 1287.60 by the time the closing bell rang on Friday. Again, it's stark contrast from the previous week, when the SPX was on the bullish rampage. And as with the NASDAQ, we think it points to a moderate reversal just around the corner.
It is worth noting, however, that the 10 day moving average was strong enough to support the index on Friday, and then push it slightly higher for the day. That line is at 1282, so that's the first barrier the bears will be watching for. But, odds are that the barrier will be broken. Similar to the NASDAQ's VXN, the S&P 500 Volatility Index (the 'VIX') is showing a new move higher after a prolonged lull around the 11 area. Plus, being stochastically overbought is starting to take a toll here. Previous stochastic sell signals are highlighted on our chart, and as you can tell, each has worked out eventually (although to varying degrees). Realistically, we'd set final support around the 50 day average, currently at 1257. It's rising, so be sure to adjust it on an ongoing basis. The maximum dip between here and there would be 30 points or less, making any correction a garden variety selloff.
As for resistance, we'll mark that at the recent peak of 1294.90 (let's call it 1295). A move above that mark would trump all of our bearish bias, and would constitute a bullish breakout. BUT, note that the market has had very erratic follow-through on all of its recent breakouts recently. The November/December move is a good example of that, as was the July August move to new highs. That's largely why we're being overly cautious (and maybe a little skeptical) of last week's huge buying spree. We can already see that the bullish enthusiasm has dies....and the sellers are starting to take action.
S&P 500 Chart - Daily

Dow Jones Industrial Average Commentary
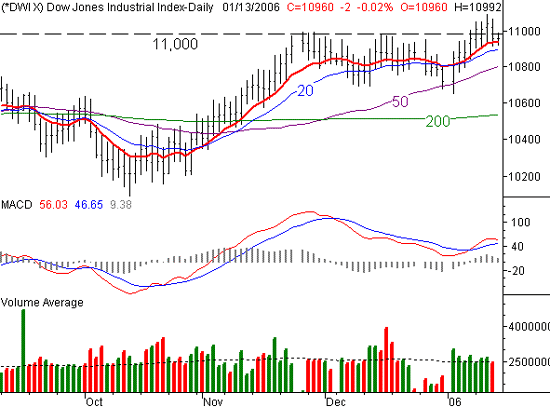
The Dow was the weakest of all last week, gaining only a point to finish Friday at 10,960. Of course, you'd have to be living in a cave to not have heard that the Dow broke through the magical 11,000 barrier, by hitting a high of 11,099 on Wednesday. We saw several reports that it was the first time the Dow had done that since 2001. Unfortunately, that's not exactly accurate - it actually hit 11,027 back in March. Splitting hairs? Maybe...maybe not. We think the fact that the Dow didn't close above 11,000 for the week is huge liability.......where was all the buying that was going to occur once the barrier was breached? The sellers were in control on Thursday and Friday.
One possible answer is this.....after getting just above 11,000 in March, the Dow then made a beeline all the way down to 9962 before the bleeding finally stopped. So, if the same mentality that prevailed then is prevailing now, the bulls may be facing some major challenges in the very near future (i.e. next week).
In the meantime, the 10 day average at 10,942 is acting as support, and the 20 day line is just below it, at 10,898. But, as with all the indices, the 50 day line is the line were watching most closely. It's at 10,800 right now. Resistance is at 11,099.
We mentioned in a recent update that we were interested in the volume rotation between the NASDAQ and the Dow as a hint of the underlying market mentality. But so far, we haven't really gotten any meaningful from the volume data. Friday's volume was lighter than it had been all week, but it was light for all the indices (which were flat for the day anyway). We'll continue to look for those subtle clues though.
Dow Jones Industrial Average Chart - Daily

Price Headley is the founder and chief analyst of BigTrends.com.