| The Wagner Daily ETF Report For February 5 |
| By Deron Wagner |
Published
02/5/2014
|
Stocks
|
Unrated
|
|
|
|
The Wagner Daily ETF Report For February 5
Although stocks closed higher with decent percent gains across the board yesterday, Monday's selling action was so ugly that a 1.2% gain in the S&P 400 on Tuesday only recovered about 1/3 of the prior day's loss.
Stocks struggled to push higher, which is evident on the 15-minute charts of all major averages, as they lacked any impulsive action. The true test for the averages will come when they eventually meet up with the declining 20-period exponential moving averages on the hourly charts, which has acted as a brick wall since the selloff began.
As mentioned in yesterday's blog post (in which we also detail a highly profitable short selling strategy), our timing model is currently in sell mode. However, we have noticed the NASDAQ Composite has held up relatively well against the S&P 500 and Dow Jones.
Looking at a daily chart of the NASDAQ vs S&P 500 SPDR ($SPY) below, notice the NASDAQ is still trading above the prior swing high and is well above the 200-day MA. The index is also just one big accumulation day away from reclaiming pivotal support of its 50-day moving average:
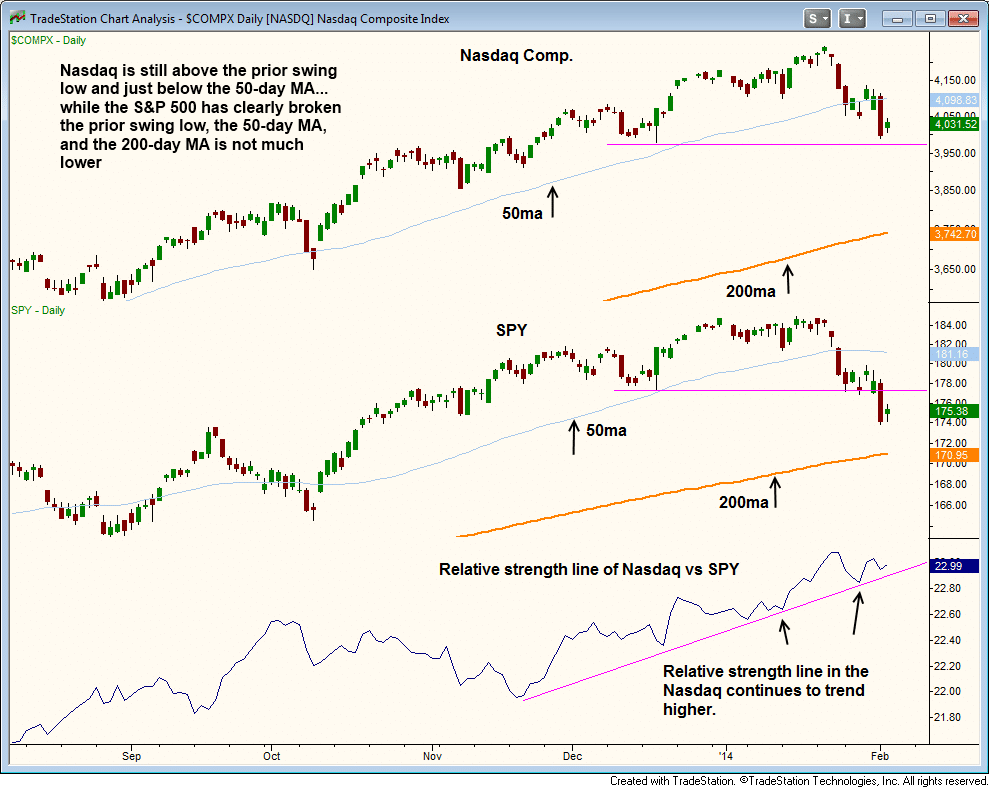
Note the relative strength line at the bottom of the chart above, which is simply the close of the Nasdaq divided by the close of SPY. Although the Nasdaq has made lower lows the past few weeks, the relative strength line continues to set higher lows.
Because of this, we are hesitant to say that the rally in the NASDAQ is dead, as it may simply need several weeks of basing action (at the very least) before it can move higher.
In scanning through the top 20 dollar-volume trading stocks in the NASDAQ, we see a majority of these charts holding up above their 50-day moving averages or a prior swing low.
-- Stocks in good to decent shape include: $FB $GOOG $NFLX $MSFT $TSLA $EBAY $GILD $QCOM $CSCO (has actually formed a higher low) $PCLN $CMCSA $BIDU $INTC $MU $WYNN
-- Stocks breaking down: $AAPL $AMZN $YHOO $INTC & CELG (though both back at prior support) $SBUX (by far the ugliest)
About 65-70% of the daily charts in top NASDAQ names remain in good shape. Until this changes, we have to assume that the NASDAQ may still have more upside once the current consolidation is over.
Nevertheless, the relative weakness in the S&P 500 and Dow Jones will prevent the NASDAQ from gaining much ground even if it it does reclaim the 50-day moving average by the end of the week.
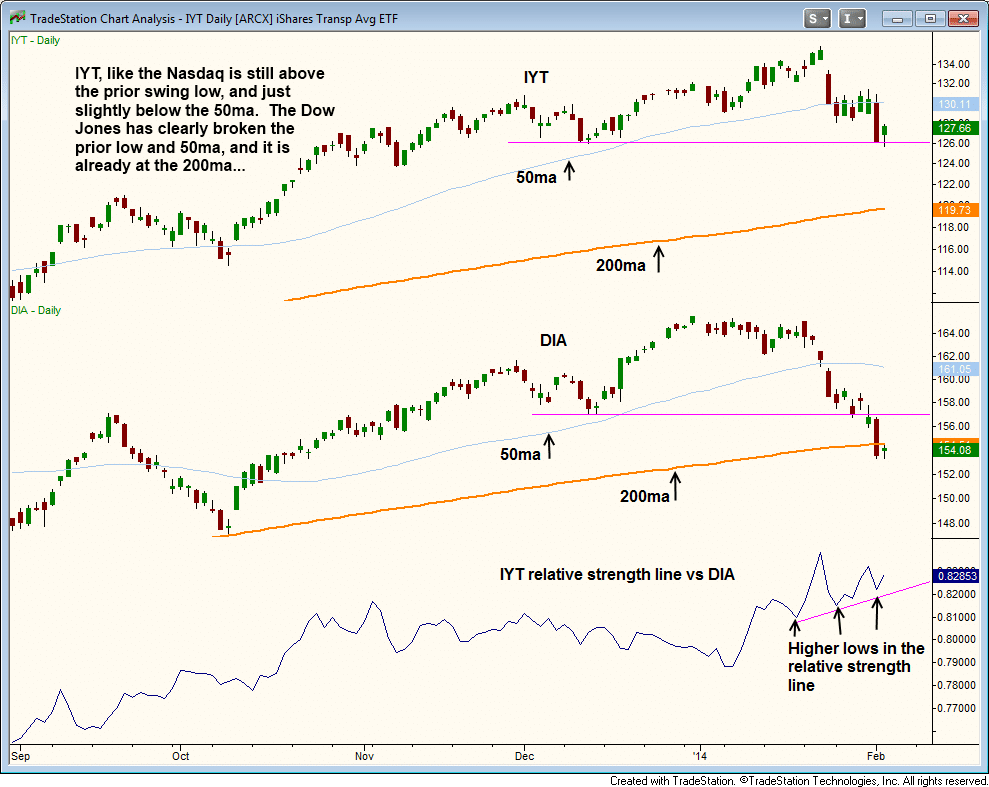
Along with the NASDAQ, we also noticed relative strength in the Transportation ETF ($IYT), which has held above a prior swing low and is just below the 50-day MA.
Its relative strength vs. the Dow Jones is interesting, as we would have expected $IYT's performance over the past few weeks to mirror the Dow.
Since the transports are often used as a leading indicator for market direction, its relative strength may be a sign that the market should not be heavily shorted until further confirmation.
The relative strength line in $IYT is still making higher lows due to the Dow Jones selling off to the 200-day MA.
US Natural Gas Fund ($UNG), which we bought in the ETF portfolio of our swing trading newsletter on January 30, is currently up about 10% from our entry point. If the price action fails to set a new swing high this week, then we could see a short-term pullback to the rising 20-day EMA within the next week or two.
The recent strength in $UNG is a good example of how ETFs can be used to locate trends outside of equities, especially when broad market conditions begin to deteriorate.
Regarding the short side of the market, it is still too soon to short with a low-risk entry price (here is why). If the market bounces on light volume for a week or two, then we could possibly see some decent setups develop.
Deron Wagner is the Founder and Head Trader of both Morpheus Capital LP, a U.S. hedge fund, and MorpheusTrading.com, a trader education firm.
|


 Free Festival of Traders Videos